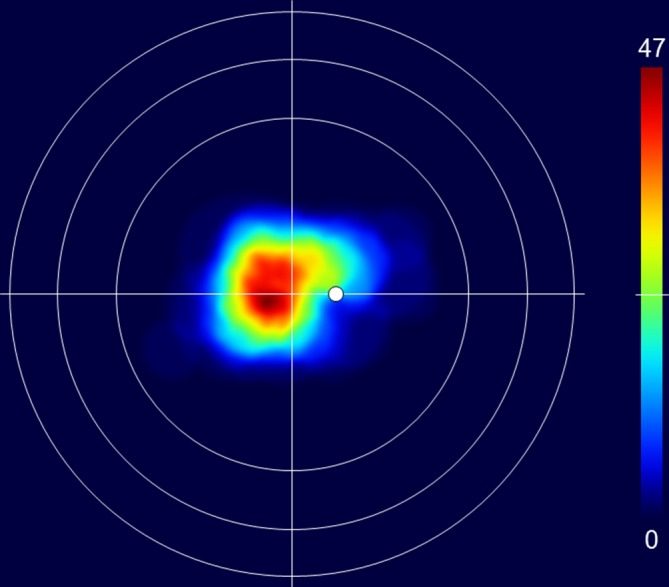
Figure 2.

Merged fundus drawings showing the location of 113 CCH on a retinal chart with a foveal centre surrounded by circles representing the equator, ora serrata and limbus. The colours on the chart indicate the number of overlapping CCH according to the colour scale bar to the right. The top of the scale (dark red) represents the maximum number of overlapping tumours (47) and the bottom (dark blue) indicates no tumours. CCH, circumscribed choroidal haemangiomas.
