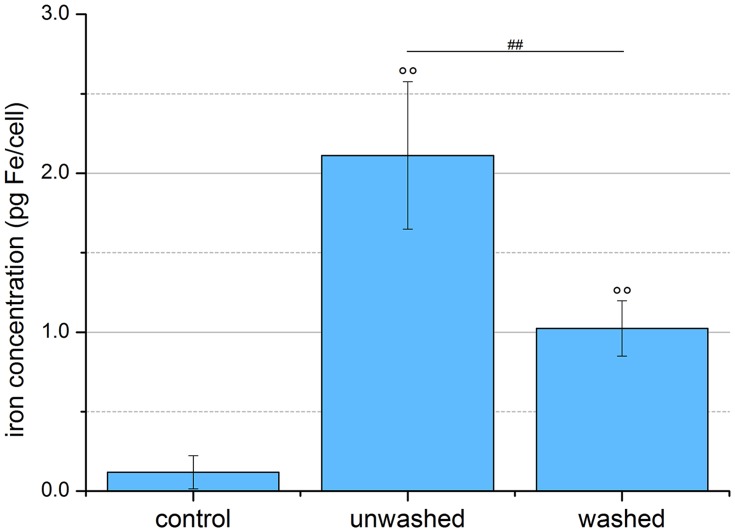
Figure 6.
Quantification of SPION uptake into cells. EL4 cells were incubated for 24 hrs with SPIONCitrate at an iron concentration of 75 µg/mL. Cell pellets of purified, unwashed and control cells were counted, lyzed and their iron content measured by AES. The purification process led to a significantly lower amount of iron in the pellet of the washed cells, but these, like the unwashed cells, still contained significantly more iron than the control cells. The experiment shown in this figure was performed in six independent experiments. The mean values with standard deviations are shown. Significances of treated cells compared to control are represented by degree signs (°°p < 0.005), significance of purified cells compared to unwashed cells is represented by number signs (##p < 0.005).
Abbreviations: AES, atomic emission spectroscopy; SPION, superparamagnetic iron oxide nanoparticle.

