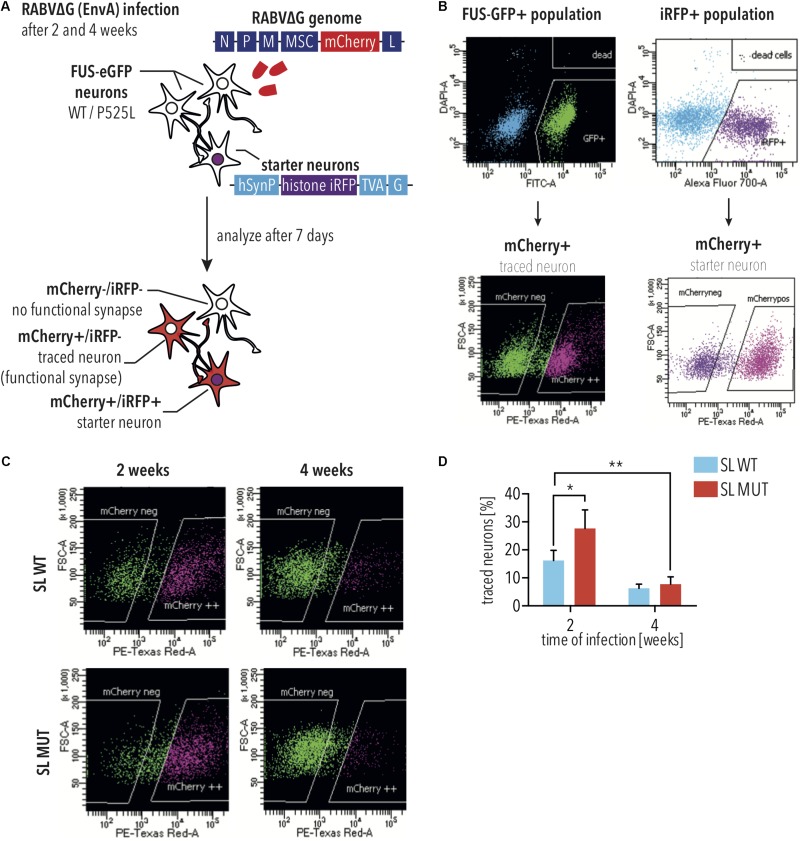
FIGURE 2.
Monosynaptic tracing using RABVΔG(EnvA) identifies neurodegeneration in FUS-P525L spinal neurons. (A) Diagram illustrating monosynaptic tracing using RABVΔG(EnvA). Starter neurons express TVA-receptor, H2B-iRFP, and the rabies glycoprotein. Following infection with RABVΔG(EnvA), starter neurons also express mCherry. (B) Diagram illustrating analysis of monosynaptic tracing using flow cytometry. To quantify traced cells, cells are gated to select GFP- and mCherry-positive cells. To quantify starter cells, cells are gated to select iRFP- and mCherry-positive cells. (C,D) FUS-P525L neurons show lower number of traced cells at 4 weeks (n = 2) in comparison to earlier timepoints (n = 4). FUS-P525L neurons show higher mCherry expression when infected 2 weeks after seeding. Error bars indicate SEM. ∗ and ∗∗ correspond to p < 0.05 and 0.01, respectively. SL, short linker; MUT, mutant; WT, wild type; histone iRFP, H2B-iRFP.

