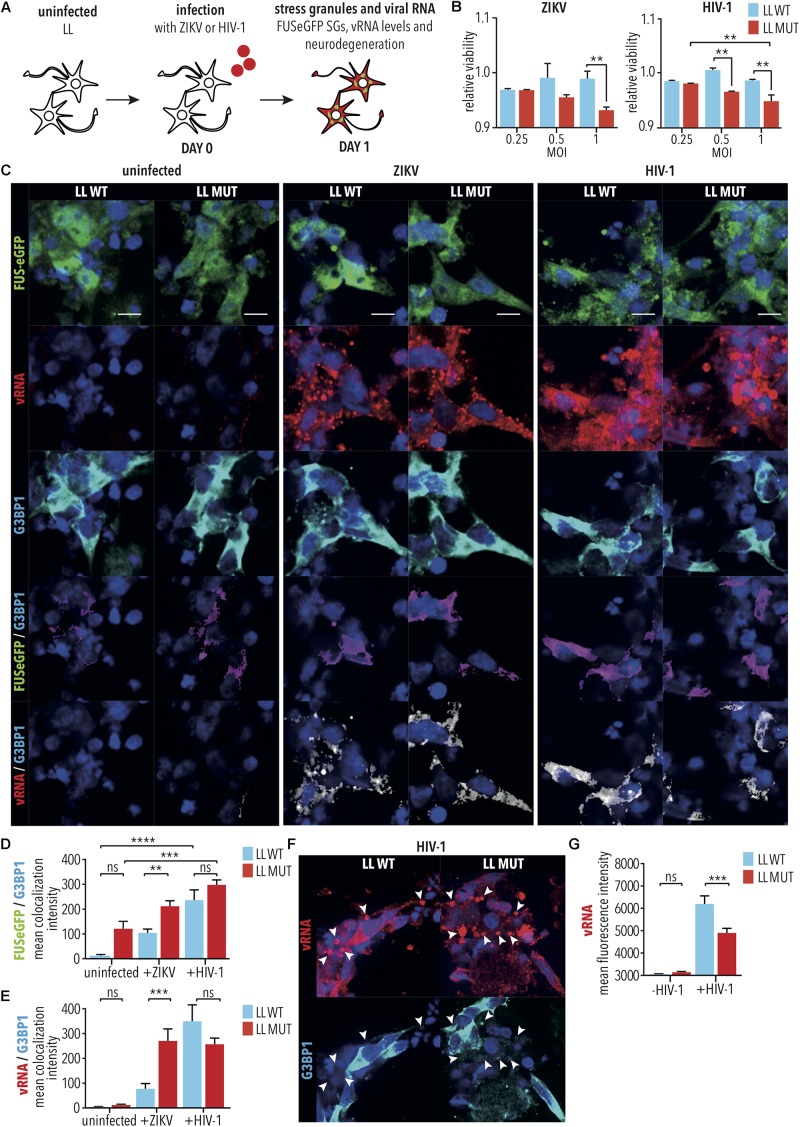
FIGURE 4.
Infection of iPSC-derived spinal neurons with HIV-1 and ZIKV. (A) Diagram illustrating HIV-1 or ZIKV infection of iPSC-derived spinal neurons with either WT FUS (LL WT) or FUS-P525L (LL MUT). (B) MTT assay was used to quantify viability of spinal neurons 1 day following infection under the indicated conditions. ∗∗ indicates p < 0.01 according to 2way ANOVA, Tukey post-test for multiple comparisons. n = 3. (C) Spinal neurons treated as indicated followed by imaging for vRNA as well as SG marker G3BP1. Scale bar = 5 μm. (D,E) Co-localization analyses between (D) G3BP1 and FUS, (E) G3BP1 and vRNA following infection of WT and FUS-P525L neurons. ∗∗, ∗∗∗, and ∗∗∗∗ indicate p < 0.01, 0.001, and 0.0001, respectively, according to 2way ANOVA, Tukey post-test for multiple comparisons. Error bars represent SEM. n = 6. (F) HIV-1 vRNA appeared to accumulate in large G3BP1-negative cytoplasmic bodies (arrow heads). (G) HIV-1 and ZIKV vRNA levels following infection of WT and mutated FUS-P525L neurons. ∗∗∗ indicates p < 0.001, according to 2way ANOVA, Tukey post-test for multiple comparisons. Error bars represent SEM. n = 6. MOI indicates multiplicity of infection; SG, stress granule; LL, long linker; MUT, mutant; WT, wild type; vRNA, viral RNA; /, colocalization.

