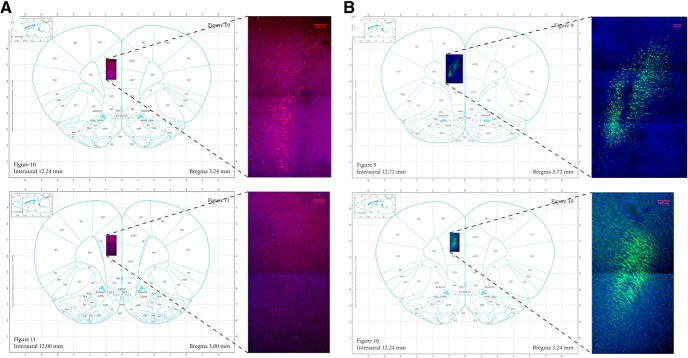
Figure 3.
Location and representative DREADDs-mCherry (A) and GFP (B) spread in the PL (area 32) at 20×. Top panels are the infusion site and bottom panels are estimated posterior-most spread. Stitching was done with a 3% overlap in the images and each frame within the final image was 2048 × 2048 pixels. Scale bars = 100 μm.

