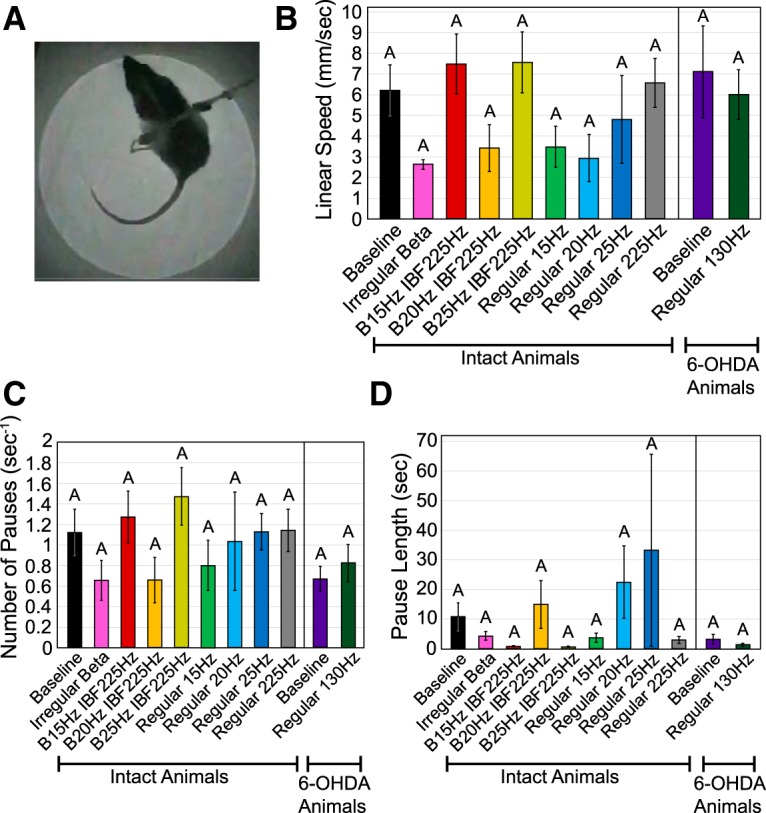
Figure 7.

Effect of STN stimulation patterns on performance in open field test. Error bars indicate mean ± SE. Patterns not sharing the same letter are significantly different from each other (p < 0.05). A, Rat was placed in a dark cylindrical chamber and its movements were video recorded. B, Linear speed as a function of stimulation pattern and lesion state. One-way RMANOVA performed on intact animal data found no significant effect of pattern (p = 0.15). See Table 1 for n for each pattern. An unpaired t test performed on 6-OHDA-treated animal (n = 5) baseline performance versus intact animal (n = 9) baseline performance found no significant effect of lesion state (p = 0.72). A paired t test performed on 6-OHDA-treated animal data (n = 5) found no significant effect of 130-Hz stimulation (p = 0.54). C, Number of pauses per second as a function of stimulation pattern and lesion state. One-way RMANOVA performed on intact animal data found no significant effect of pattern (p = 0.16). See Table 1 for n for each pattern. An unpaired t test performed on 6-OHDA-treated animal (n = 5) baseline performance versus intact animal (n = 9) baseline performance found no significant effect of lesion state (p = 0.11). A paired t test performed on 6-OHDA-treated animal data (n = 5) found no significant effect of 130-Hz stimulation (p = 0.22). D, Pause length as a function of stimulation pattern and lesion state. One-way RMANOVA performed on intact animal data found no significant effect of pattern (p = 0.44). See Table 1 for n for each pattern. An unpaired t test performed on 6-OHDA-treated animal (n = 5) baseline performance versus intact animal (n = 9) baseline performance found no significant effect of lesion state (p = 0.17). A paired t test performed on 6-OHDA-treated animal data (n = 5) found no significant effect of 130-Hz stimulation (p = 0.30).
