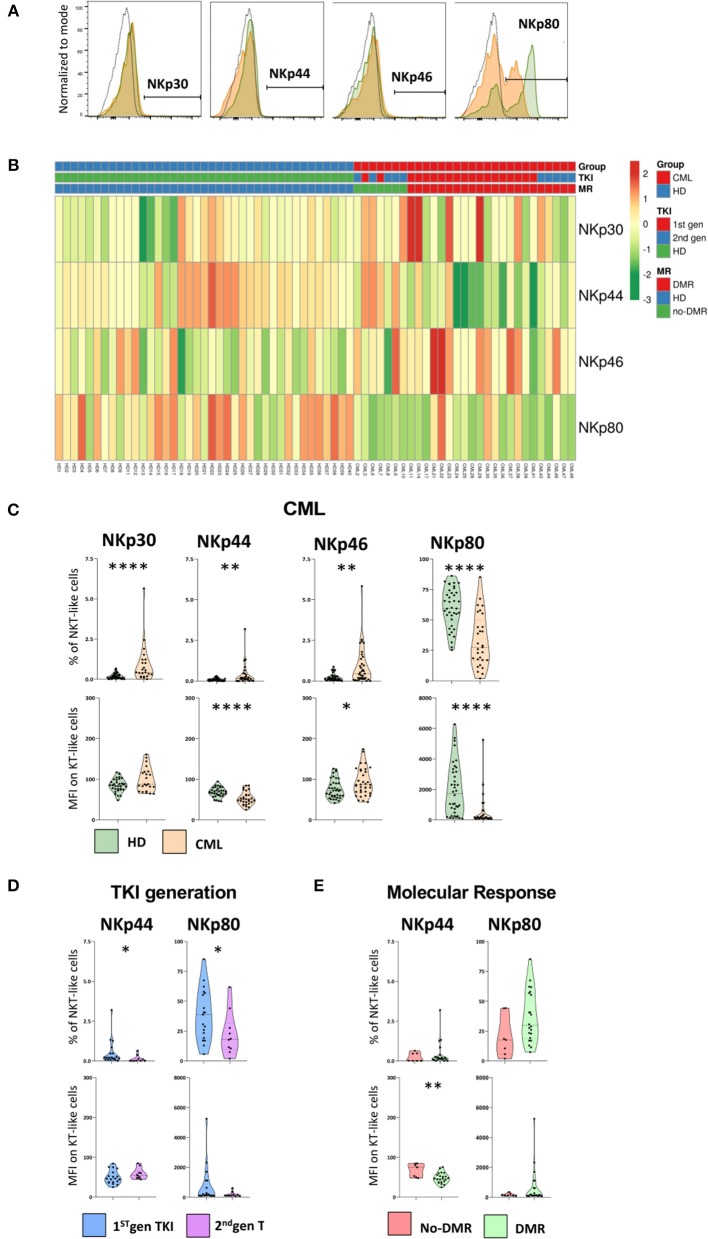
Figure 5.
NCRs and NKp80 are significantly altered on NKT-like cells in CML patients. Heparinized fresh whole blood samples were stained with extracellular antibodies and analyzed by multiparametric flow cytometry. (A) Representative histograms relative to the cut-off for positive NKT-like cells in terms of, from left to right, NKp30, NKp44, NKp46, and NKp80. The dashed black lines represent the isotype control, the fulfilled green lines represent the HD group and the fulfilled red lines represent the CML group. (B) Heatmaps for the frequency of NKT-like cells expressing NKp30, NKp44, NKp46, and NKp80 in HD (n = 40) and CML patients (n = 48) according to TKI generation [1st (n = 36) or 2nd (n = 12)] and molecular response [DMR (n = 38) or No-DMR (n = 10)]. (C) NKp30, NKp44, NKp46 and NKp80 relative frequencies and MFI of NKT-like population from CML patients (n = 23, n = 29, n = 36 and n = 29, respectively) and HD (n = 39, n = 39, n = 39 and n = 38, respectively). (D) Relative frequencies and MFI of NKp44 and NKp80 in the NKT-like population according to 1st gen. TKI (n = 19) and 2nd gen. TKI (n = 10). (E) Relative frequencies and MFI of NKp44 and NKp80 of NKT-like cells from patients without deep molecular response (n = 9) or with deep molecular response (n = 25). Mann Whitney U-test was used for statistical analysis and the charts represent the mean ± standard deviation. HD, Healthy donors; CML, treated CML patients; TKI, Tyrosine Kinase Inhibitor; 1st gen. TKI, 1st generation TKI CML patients; 2nd gen. TKI, 2nd generation TKI CML patients; DMR, deep molecular response; no-DMR, without deep molecular response; MFI, Median Intensity Fluorescence; p-value <0.05*, <0.01**, <0.001***, or <0.0001****.

