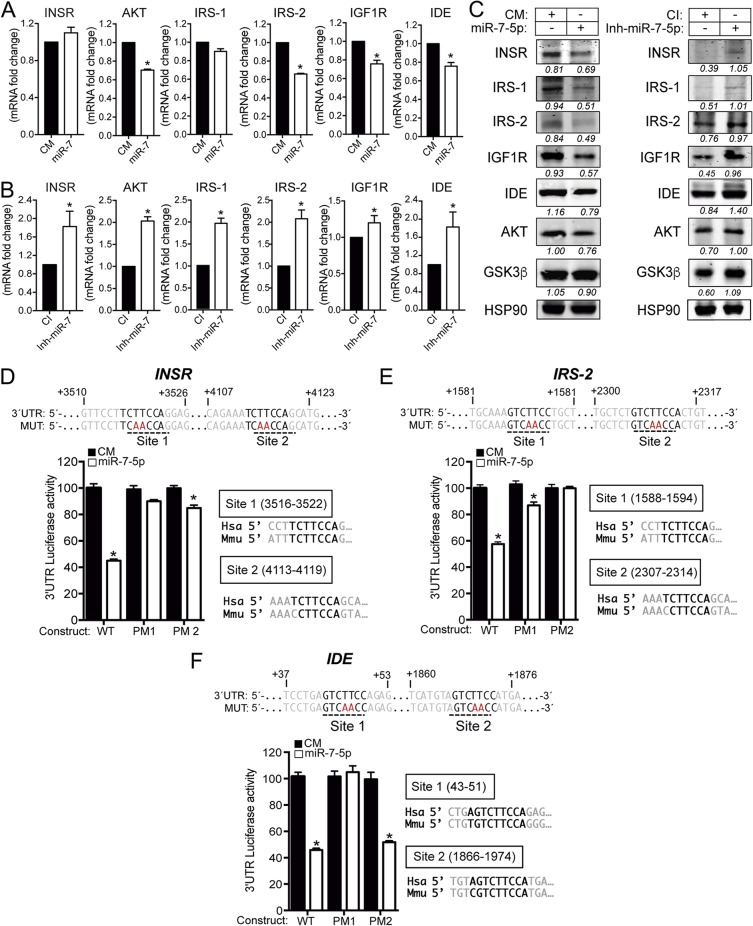
FIG 4.
miR-7 regulates multiple genes involved in the insulin signaling pathway in neuronal cells. (A and B) qRT-PCR analysis of INSR, AKT, IRS-1, IRS-2, IGF1R, and IDE mRNA expression levels in N2a cells transfected with a control mimic (CM) or an miR-7-5p mimic (miR-7) (A) or a control inhibitor (CI) or an miR-7-5p inhibitor (Inh-miR-7) (B). Data are expressed as relative expression levels and correspond to the means ± SEM from three independent experiments performed in triplicate *, P < 0.05 (significantly different from cells transfected with a CM [normalized to a value of 1]). (C) Representative Western blots of predicted insulin pathway-related genes in N2a cells transfected with a CM or miR-7 (left) or a CI or Inh-miR-7 (right). Heat shock protein 90 (HSP90) was used as a loading control. (D to F, top) Human INSR, IRS-2, and IDE 3′-UTR sequences containing target sites for miR-7-5p. Underlined sequences indicate the miR-7 binding sites. Nucleotides highlighted in red indicate the point mutations in the miR-7 binding sites. (Bottom) Luciferase reporter activity in COS-7 cells transfected with the CM or miR-7 mimic and the INSR, IRS-2, and IDE 3′ UTRs (wild type [WT]) or the constructs containing the indicated point mutations (PM). Data are expressed as relative luciferase activities compared to the activity in control samples cotransfected with an equal concentration of the CM and correspond to the means ± SEM from three experiments performed in triplicate. *, P < 0.05 (significantly different from cells cotransfected with CM and the WT or PM 3′ UTR).

