FIG 5.
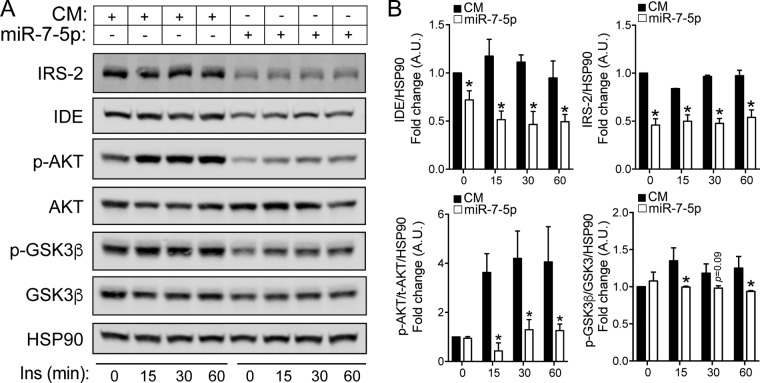
miR-7 regulates insulin signaling in N2a cells. (A) Representative Western blot analysis of IRS-2, IDE, p-AKT, AKT, p-GSK3β, and GSK3β in N2a cells transfected with the CM or miR-7 and treated with 100 nM insulin (Ins) at the indicated time points. IRS-2 and IDE were used as positive controls for the effect of miR-7 overexpression. HSP90 was used as a loading control. (B) Relative protein levels compared to HSP90 (IRS-2 and IDE) and p-AKT/total AKT ratio and p-GSK3β/total GSK3β ratio compared to HSP90. *, P < 0.05 (significantly different from cells transfected with the CM at each time point of insulin treatment). Data correspond to results from a representative experiment among three that gave similar results. A.U., arbitrary units.

