FIG 6.
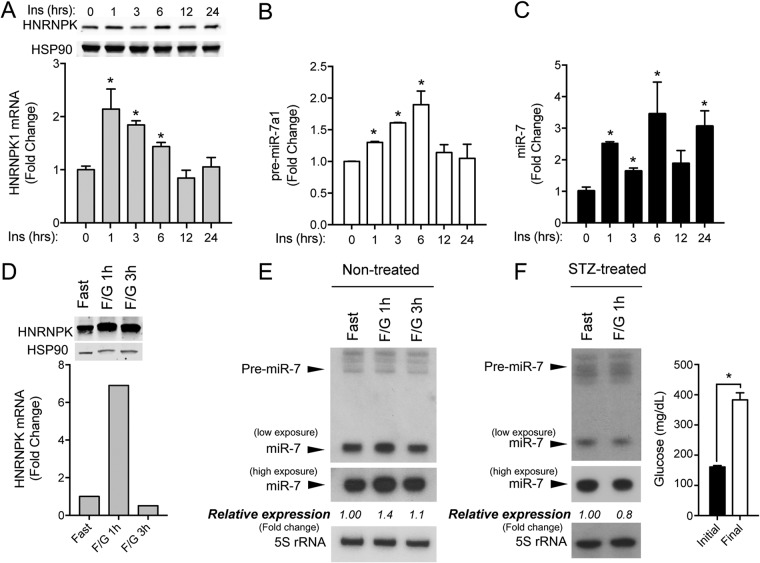
Expression of miR-7/HNRNPK is regulated by insulin in vitro and in vivo. (A) qRT-PCR and Western blot analysis of HNRPK in N2a cells stimulated with 100 nM insulin at the indicated time points. (B and C) qRT-PCR analysis of precursor miR-7a-1 and mature miR-7 in N2a cells showing significant induction upon insulin stimulation. Data represent the means ± SEM of results from three experiments performed in triplicate. *, P < 0.05 (significantly different from cells treated with insulin at time zero). (D) qRT-PCR and Western blot analysis of HNRNPK in hypothalamus from fasted mice after 1 (F/G 1h) and 3 h (F/G 3h) of i.p. injection with 20 g/kg of body weight of glucose (n = 4 per group). (E) Northern blot analysis of miR-7 in hypothalamus from mice treated as described above for panel D (n = 4 per group). 5S rRNA was used as a loading control. Relative expression of miR-7/5S is expressed as a fold change compared to hypothalamus from fasted mice. (F, left) Northern blot analysis of miR-7 in hypothalamus from STZ-diabetic mice under fasting conditions after 0 and 1 h of i.p. injection with 20 g/kg of body weight of glucose. 5S rRNA was used as a loading control. Relative expression of miR-7/5S is expressed as a fold change compared to that in control hypothalamus (Fast). (Right) Initial glycemic levels before and at the end of the STZ treatment (n = 4 per group). *, P < 0.05 compared with initial glycemia.

