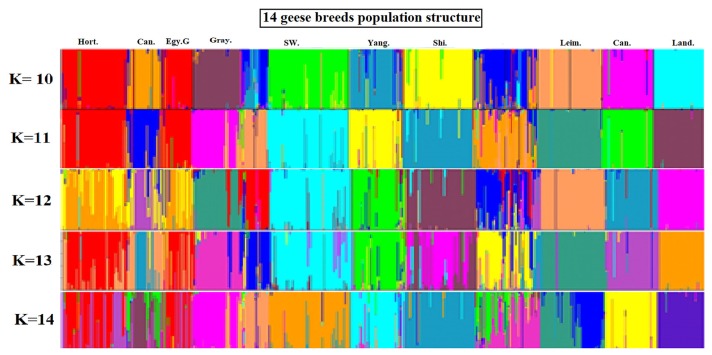
Figure 3.
Structural analyses of goose populations. Each genotyped goose is represented by a single vertical line divided into K colors, where K is the number of clusters assumed in each structure analysis. Each vertical bar represents an individual goose. The colors on a vertical bar represent the probability that an individual belongs to that cluster. The Clustering diagrams of 14 goose breeds obtained from K = 10 to K = 14 using Q matrices of runs with best similarities When K = 10 there was a clear clustering for Hort, Can, Egy G, Gray, Sw, Yang, Shi, Leim, Ca, and Land. K = 11 was the same as K = 10 except for more interference between the breeds. K = 12 the clusters with clear identification were Gray, Sw, Yang, Shi, Leim, Ca, and Land. K = 13 can see clusters for only Gray, Sw, Yang, Leim, Ca, and Land. K = 14 the clearest clusters were for Gray, Sw, Yang, Shi, Ca, and Land. Hort, Hortobagy goose; Can, Canada goose; Egy G, Egyptian goose (grey variety); Gray, Graylag goose; Sw, along with swan; Yang, Yangzhou goose; Shi, Shitou goose; Leim, Leime goose; Ca, Carlos goose; Land, Landes goose.

