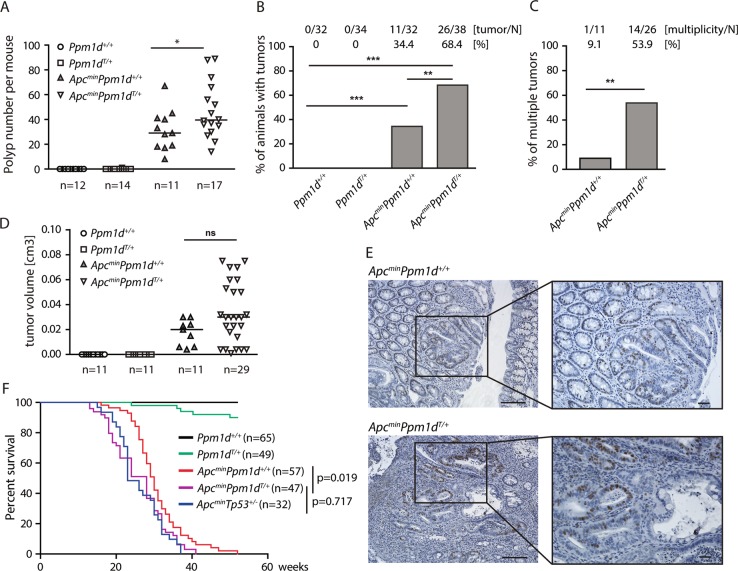
Fig. 4. Truncation of PPM1D promotes growth of APC-induced colon tumors.
a Wild-type Ppm1d+/+, Ppm1dT/+, Apcmin, and ApcminPpm1dT/+ mice were sacrificed at 16 weeks and the number of intestinal polyps was scored (p = 0.044). Numbers indicate numbers of animals of each genotype. b Wild-type Ppm1d+/+, Ppm1dT/+, Apcmin, and ApcminPpm1dT/+ mice were sacrificed at 16 weeks and tumor formation in colon was scored. Proportion of animals developing tumor(s) is shown, N indicates number of animals of each genotype. Statistical significance was determined by two tailed Fisher’s exact test (***p < 0.001, **p < 0.01, *p < 0.05). c Proportion of animals with multiple tumors in mice from b was scored. N indicates number of animals that developed at least one tumor. Statistical significance was determined by two tailed Fisher’s exact test (***p < 0.001, **p < 0.01, *p < 0.05). d Volume of the colon tumors developed in mice with indicated genotypes. In case of multiplicity, the largest tumor was quantified. Line indicates mean. e Representative sections of colon tumors from 16 weeks old Apcmin, ApcminPpm1dT/+ mice stained for Ki-67. Scale bars 50 and 25 μm. f Kaplan–Meier survival plot of mice of indicated genotypes over a period of 50 weeks. Statistical significance was determined by log rank test as follows Apcmin vs. ApcminPpm1dT/+ p = 0.019; Apcmin vs. ApcminTp53+/− p = 0.008; ApcminPpm1dT/+ vs. ApcminTp53+/− p = 0.717; Ppm1d+/+ vs. Ppm1d T/+ p = 0.014). Numbers of animals per group are shown

