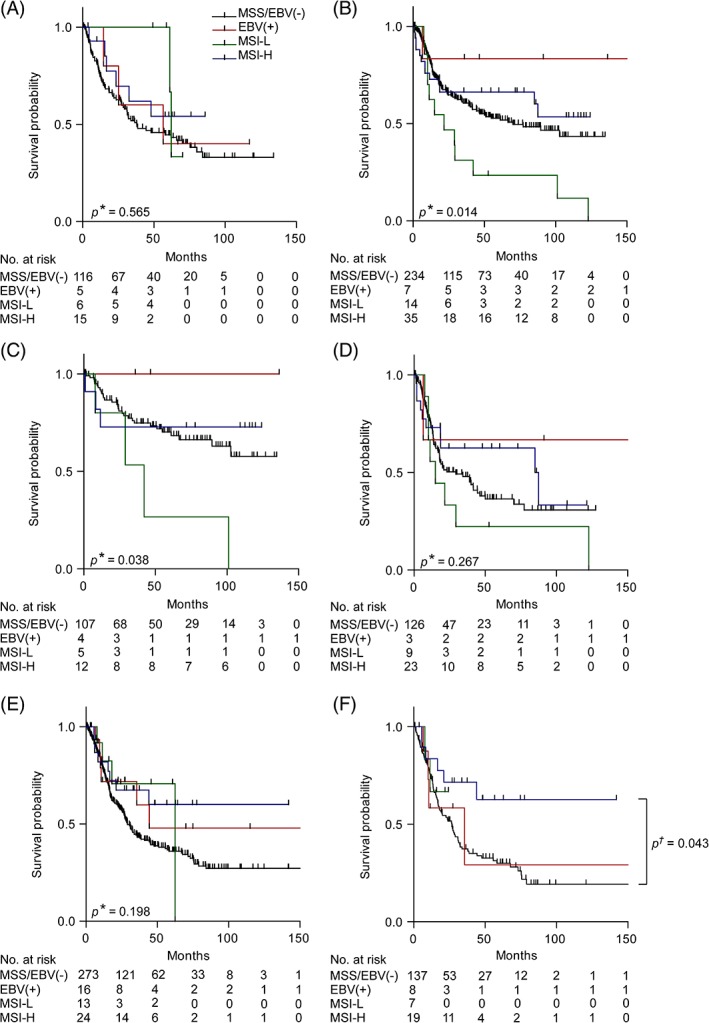
Figure 3.

Discrimination of patient survival by EBV and MSI status. Kaplan–Meier curves of the EBV(+), MSI‐L, MSI‐H and MSS/EBV(−) patients are shown. Tumour biopsies before neoadjuvant CTx (A). Resected tumours from patients treated without neoadjuvant CTx: all patients (B), subgroups with clinical tumour stage cT2 (C) and cT3/cT4 (D). Resected tumours from patients after neoadjuvant CTx: all patients (E) and subgroup with TRG3 (F). *P value of log rank test (overall); † P value of Cox's regression.
