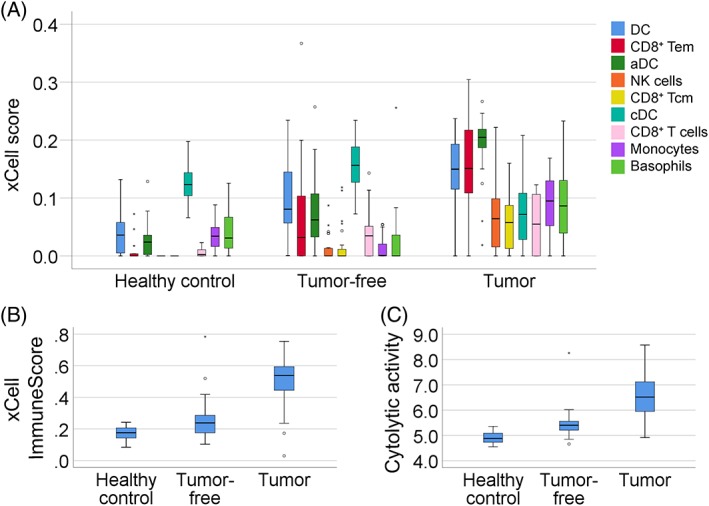
Figure 1.

Immune features in tumor and clinically tumor‐free tongue samples from SCCOT patients compared to control tongue from healthy individuals. (A) Box‐plots of immune cell types according to xCell enumeration scores in tumor‐free samples compared to healthy controls (p < 0.05). Changes in the tumor samples are also shown. Small circles indicate outliers and asterisks indicate extreme outliers. (B) xCell‐derived ImmuneScores (p < 0.05 tumor‐free samples versus healthy control; p < 0.001 tumor‐free versus tumor). (C) Cytolytic activity (p < 0.001 tumor‐free versus healthy controls; p < 0.001 tumor‐free versus tumor).
