
Figure 1.
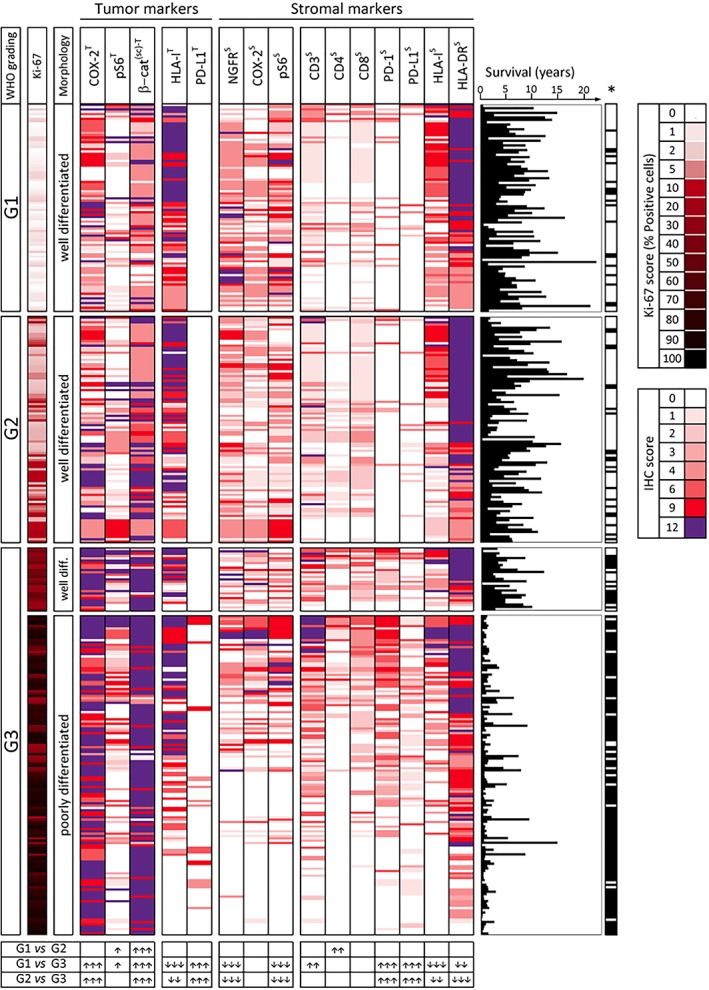
MoTIFs profile of 350 GEP‐NENs classified according to WHO grading, Ki‐67 score and morphology. Results of semi‐quantitative analysis (IHC scores) for expression of the indicated markers in each lesion is represented by the color code shown on the right‐hand side of the figure. Expression of each marker was evaluated in the tumor (superscript T) or in the stroma (superscript S). The β‐cateninT IHC score reflects surface or cytoplasmic (s/c) staining. To aid the interpretation of data, within each subset defined by WHO grading, the tumor samples were ranked according to the sum of IHC score values of the immune‐related markers (HLA‐IT, PD‐L1T, CD3S, CD4S, CD8S, PD‐1S, PD‐L1S, HLA‐IS, HLA‐DRS). Therefore, lesions with the highest sum of these IHC scores are at the top of each grading subset. Ki‐67 score for each lesion was color coded as indicated in the legend on the right‐hand side of the figure. For each lesion a graph is shown indicating length of patient survival (years) and related death/censoring information (*Black: DOD; white: censored). Table at the bottom of the figure: expression of each marker was compared in the three main WHO grading subsets by Kruskal–Wallis test followed by Dunn's multiple comparison test. Up arrows and down arrows indicate increase or decrease of expression, respectively, in the subset with higher grading compared to the subset with lower grading. Number of arrows (1, 2, or 3) for each comparison reflects increasing significance (p < 0.05, p < 0.01, or p < 0.001, respectively).