Figure 2.

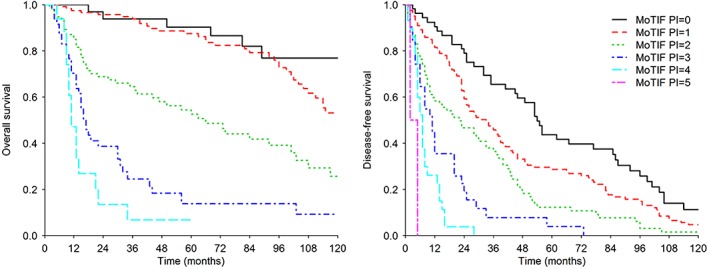
Kaplan–Meier curves for OS (left) and DFS (right) according to the PIs based on MoTIFs in the INT series. The MoTIFs PI for OS assumed values from 0 to 4, and the MoTIFs PI for DFS assumed values from 0 to 5.

Kaplan–Meier curves for OS (left) and DFS (right) according to the PIs based on MoTIFs in the INT series. The MoTIFs PI for OS assumed values from 0 to 4, and the MoTIFs PI for DFS assumed values from 0 to 5.