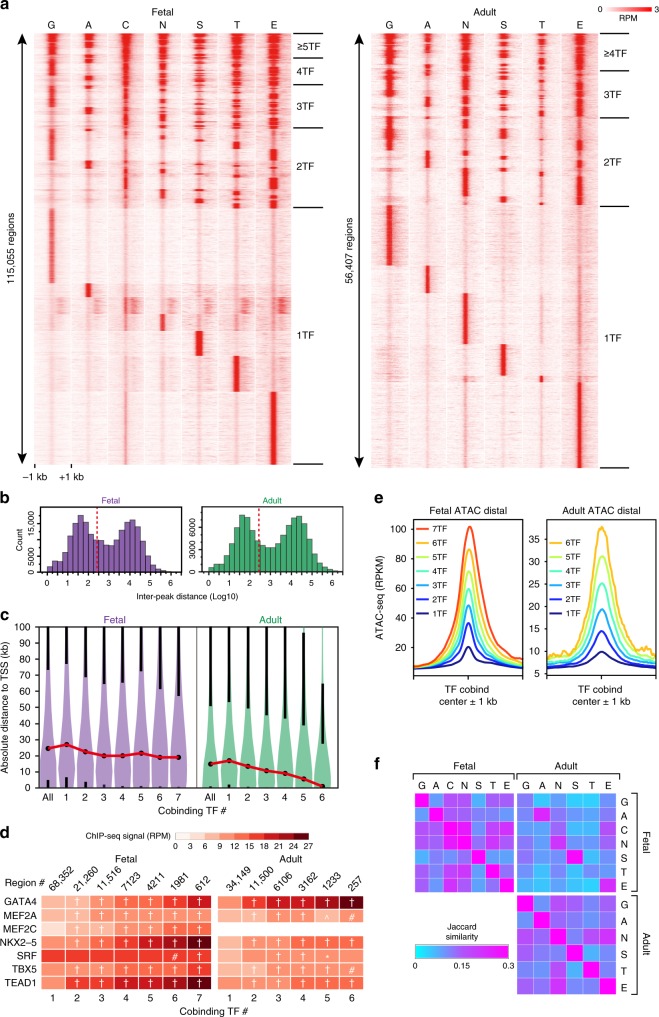
Fig. 2.
TF co-occupancy patterns in fetal and adult heart. a Heatmap of TF co-occupied regions, defined by merging individual TF peaks whose summits were within 300 bp of one another. The same region is shown in each row, with each column representing the signal of the indicated factor across the region. Regions are sorted by the pattern of co-occupying TFs. b Histogram of the distance between neighboring TF summits. TF regions within 2 kb of the TSS were excluded. Note the bimodal distribution. Dotted red line indicates 300 bp, the threshold used to define TF co-occupancy. c Violin plots showing distance of regions co-occupied by multiple TFs relative to gene TSSs. Black dots indicate median values, black whiskers start at the 1st and 3rd quartiles and extend 1.5 times the interquartile distance. The red lines connecting median values highlight the trend in the data. In adult heart, the number of co-occupying TFs was inversely related to distance between TF regions and TSS. d Relationship of number of cobinding TFs and mean TF bioChIP-seq signal. The bioChIP-seq signal, expressed as reads per million (RPM), within 200 bp regions centered on the MACS2-predicted summit of each TF within a TF-cobound region, is plotted as a heatmap. Steel non-parametric test vs. 1 TF: *, #, ^, † indicate P < 0.05, P < 0.01, P < 0.001, and P < 0.0001, respectively. e Average ATAC-seq signal in reads per kilobase per million reads (RPKM), centered at distal regions co-occupied by the indicated number of TFs. Chromatin accessibility, as measured by ATAC-seq, increased with increasing number of co-occupying TFs. f Pairwise co-occupancy (Jaccard Similarity) of TFs in fetal and adult heart (upper left and bottom right matrices), and across stages (upper right matrix). Note stage-specific differences in pairwise co-occupancy. Source data for panels b–d, f are provided as a Source Data file

