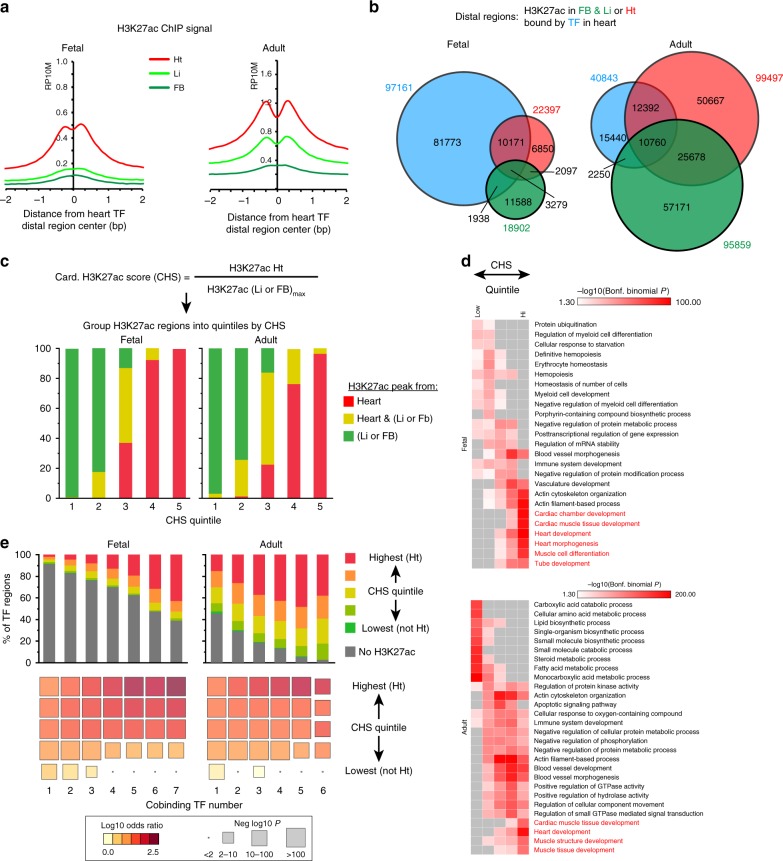
Fig. 3.
Relationship of TF and H3K27ac occupancy. a Average plot of H3K27ac ChIP-seq signal from heart, liver, or forebrain at heart distal TF summits. RP10M, reads per 10 million reads. b Overlap of distal H3K27ac regions in heart (Ht), forebrain (FB), and liver (Li) with distal heart TF regions. c Distal regions with cardiac-enriched H3K27ac occupancy. Distal regions were ranked by their cardiac H3K27ac score (CHS), which was the ratio of the H3K27ac signal in heart to the maximum signal in either forebrain or liver. The highest two quintiles were designated as cardiac H3K27ac regions (cHRs). d Biological process gene ontology terms for distal H3K27ac regions by CHS quintile. The top five terms for each quintile are shown. Red text highlights heart-related terms. Gray boxes indicate non-significant enrichment P-values. e Overlap of distal TF co-occupied and H3K27ac regions, stratified by CHS quintile and number of co-occupying TFs. In the lower bubble plot, color signifies odds ratio, and size denotes −log10(Fisher test P-Value). Source data for panels c–e are provided as a Source Data file

