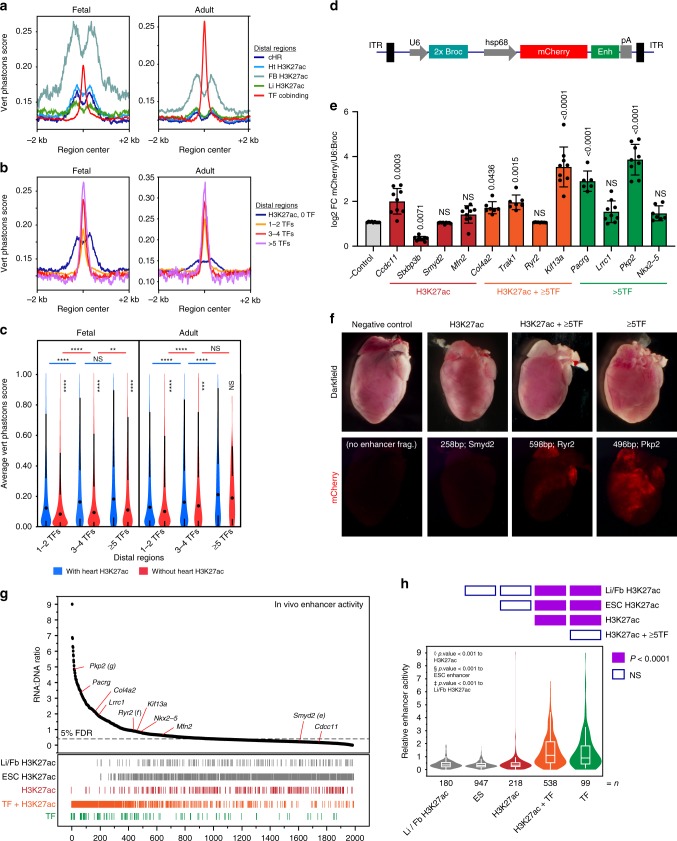
Fig. 4.
Transcriptional enhancer function of TF regions. a Average plot of 30-way vertebrate Phastcons scores at distal H3K27ac and TF regions. b Average plot of Phastcons scores at distal regions co-occupied by the indicated number of TFs, or by distal heart H3K27ac regions that do not overlap TF regions. c Average Phastcons scores in distal regions (center ± 150 bp) co-occupied by the indicated number of TFs with or without heart H3K27ac in fetal or adult heart. Steel-Dwass: ****P < 0.0001; ***P < 0.001; **P < 0.01; NS, not significant, mean values represented by dot (black). d–f Individual enhancer activity in murine cardiomyocytes was measured using an AAV9-based assay. Vector construct (d) contained minimal hsp68 promoter driving mCherry, with enhancer element (Enh) located in the 3′ UTR. U6:2xBroccoli was used to normalize transduction efficiency. Twelve enhancers belonging to three groups (H3K27ac+ TF–; H3K27ac+ ≥5TF+; H3K27ac– ≥5TF+) were individually tested in vivo. Normalized enhancer activity was compared to empty vector (AAV9;Hsp68:mCherry-no enhancer; n = 9) using Dunnett’s test. Error bars represent s.d. e Representative dark field and fluorescent wholemount images of adult (P28) mouse hearts showing enhancer activity for each group of cardiac enhancers. g, h AAV-based massively parallel reporter assay measurement of the activity of 1982 candidate enhancers and negative controls in cardiomyocytes in vivo. AAV library was delivered at P0 and measured in ventricles at P7. g Activity, expressed as enhancer reads in RNA normalized to enhancer abundance in AAV genomic DNA, was plotted versus region activity rank. Relative rank of individual regions of each class is represented by vertical lines below plot. 5% false discovery rate (FDR) threshold (dotted line) indicates the 95th percentile of ESC H3K27ac negative control region activity. h Relative activity of each class of regions tested is summarized displaying mean (line) and 95th confidence interval (box) with s.d. (whiskers). Heatmap above violin plot shows statistical significance of inter-group comparisons (Steel-Dwass). Source data for panels c, e, g are provided as a Source Data file

