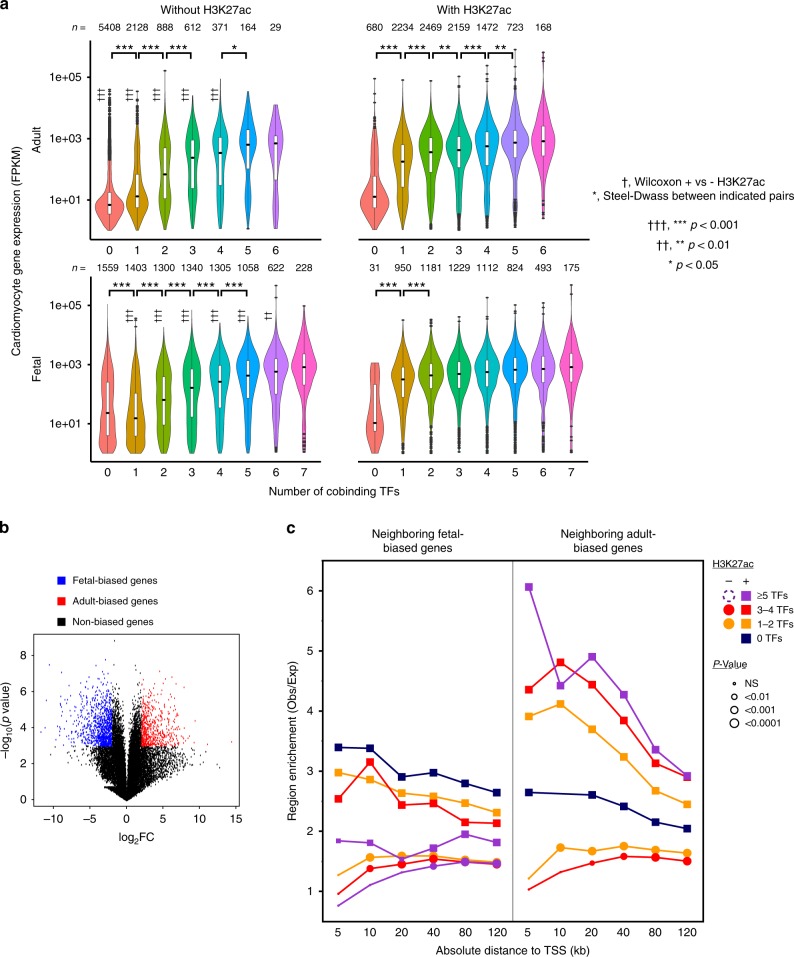
Fig. 6.
Stage-specific TF chromatin occupancy regulates stage-specific gene expression. a Cardiomyocyte gene expression association with TF regions and heart H3K27ac. Genes were assigned to the region within 100 kb with the highest number of cobinding TFs. This region was classified as with or without H3K27ac overlap. †, Wilcoxon test for expression with heart H3K27ac compared to without for same TF number and stage. *, Steel-Dwass for expression difference between indicated groups. n indicates group size and vertical line denotes s.e.m. with outliers plotted. b, c Fetal or adult-based cardiac gene expression association with fetal-TF or adult-TF regions. Volcano plot (b) of fetal vs. adult cardiomyocyte gene expression shows fetal-biased genes (blue) and adult-biased genes (red), defined as −log10(P value) > 3 and abs(log2FC) > 2. Right plot (c) shows enrichment (observed/expected) of TF or H3K27ac regions within the indicated distance of the TSS of fetal-biased or adult-biased genes. The expected number was determined by randomly permuting the TF or H3K27ac regions 10,000 times across the mappable genome (see the section Methods). The size of symbols indicates the permutation P-value. Squares and circles indicate regions with or without H3K27ac co-occupancy, respectively. TF co-occupied region sets containing <100 members were excluded (dashed symbol in figure legend). Source data for panels a, c are provided as a Source Data file

