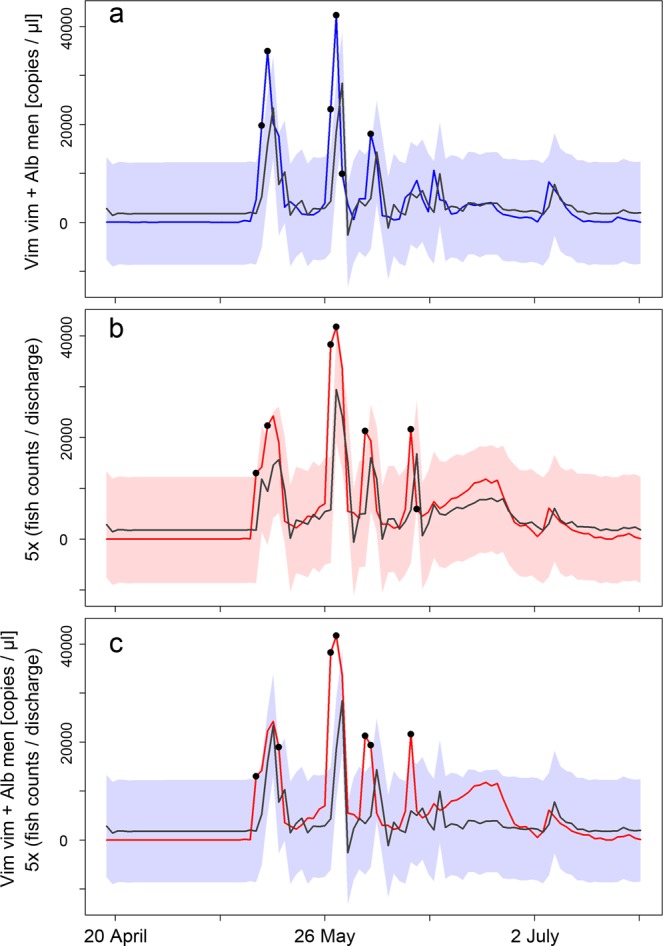
Figure 4.

Time series models in comparison to measured target eDNA concentration and fish counts. (a) The ARIMA (2, 0, 0)-modelled eDNA concentration (grey line) and 95% confidence area (blue shading) in comparison to measured eDNA concentration (blue line). (b) Modelled fish counts using the same ARIMA model structure (grey line; red shading for 95% confidence area) in comparison to the actual fish counts (red line). (c) ARIMA-modelled eDNA concentrations (grey line and blue shading) in comparison to actual fish counts (red line). Values outside the 95% confidence area are marked as black dots, eDNA concentration is based on the sum of Alburnus mento and Vimba vimba (copies/µl extract) from point 1 samples, and fish counts are the sum of mean counts from all river sections divided by discharge; to enable direct comparison between time series, these values were additionally multiplied by five.
