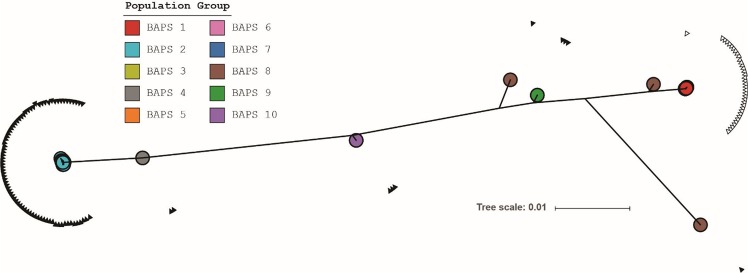
Figure 5.
Phylogenetic tree based on the concatenated nucleotide alignment of capsule genes cpsA-cpsN. For clarity, names of the isolates are omitted. Colored circles indicate the BAPS population groups to which an isolate belongs. BAPS groups 1, 3 and 5–7 are highly similar and are located under the red circle of BAPS group 1. A filled or empty triangle respectively represents the presence or absence of a deletion between the cpsN and glf genes.

