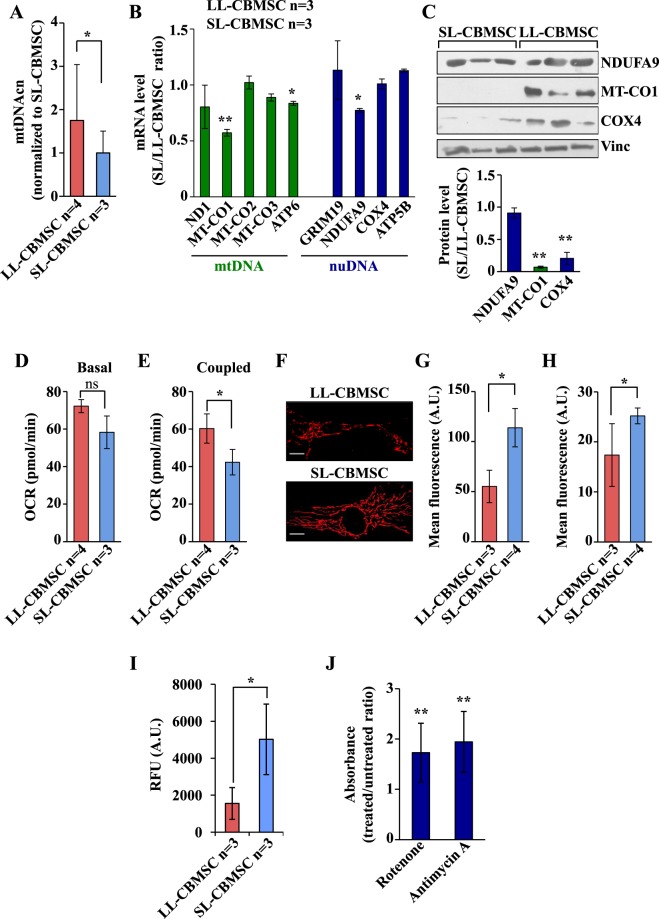
Figure 3.
SL-CBMSC as compared to LL-CBMSC show a decrease of mitochondrial OXPHOS expression and function associated to higher mitochondrial potential. Cells were cultured for 48 hours in standard growth condition and then analyzed. (A) LL-CBMSC showed higher mtDNAcn, assessed by qPCR. Mean and standard deviation are represented. (B) qPCR analysis of the expression levels of the indicated mRNA, codified by mitochondrial DNA (mtDNA) and nuclear DNA (nuDNA). Actin was used as housekeeping gene to normalize the expression levels. (C) Western blot analysis of the expression levels of the indicated mitochondrial proteins. Vinculin was used to normalize the expression levels. Blots shown are derived from multiple gels run under the same experimental conditions. The membrane was cut based on molecular weight. All full length blots are presented in supplementary Fig. 4A. (D,E) Basal (D) and ATP production-coupled (E) oxygen consumption rate (OCR). The latter was calculated subtracting the OCR upon oligomycin to the basal OCR. Data are represented as mean ± SEM of the different cell populations. For each cell population n ≥ 2 biological analyses were performed with n ≥ 5 replicates for each. (F) Representative confocal microscopic images after staining with TMRE (50 nM). Scale bar 20 µm. (G-H) Quantification of TMRE signal using confocal microscopy (G) and flow cytometry (H). Mean and standard deviation are represented. For panels B-H, ns, not statistically significant; *p < 0.05, **p < 0.01, (Student’s t-test, SL-CBMSC vs. LL-CBMSC). (I) ROS levels were addressed by DHE staining and represented as relative fluorescence units (RFU) measured at 635 nm. Mean and standard deviation are represented; *p < 0.05 (Mann-Whitney test, SL-CBMSC vs. LL-CBMSC). (J) Senescence induced in LL-CBMSC treated by inhibitors of complex I (rotenone) and complex III (antimycin A) was detected by β-galactosidase assay and quantified as 650 nm absorbance. Mean and standard deviation are represented; **p < 0.01 (Mann-Whitney test, treated vs. untreated LL-CBMSC).

