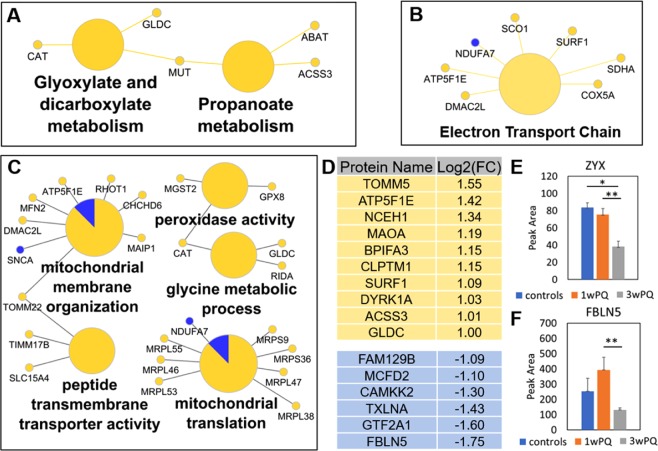
Figure 3.
Temporal dynamics of RPE intracellular proteome from one week to three weeks of chronic ROS. Proteins that changed only in the three-weeks/one-week comparison found enriched in (A) KEGG pathways, (B) Wikipathways, or (C) Gene Ontology Molecular Function and Biological Processes. All pathway enrichment analysis used a minimum p-value of 0.001. (D) List of proteins that increased or decreased at least 2-fold. (E) Quantification of Zyxin protein from the average of the following peptides: SPGAPGPLTLK2+, QNVAVNELCGR2+, and FGPVVAPK2+. (F) Quantification of Fibulin-5 protein from the peptide DQPFTILYR2+. Error bars show the standard error. Significant changes defined as at least 1.5-fold and q-value < 0.05 (*), q-value < 0.01 (**), and q-value < 0.001 (***).

