Figure 4.
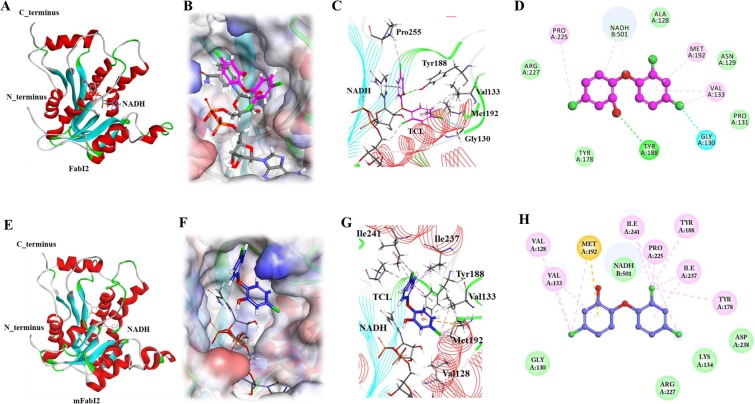
Homology model and docking of FabI2, mFabI2 and TCL. (A) Optimized model of FabI2. Alpha-helices flank the parallel β-strands and form an ENR-like architecture. NADH is shown as a stick model. (B) Three-dimensional (3D) view of docked TCL in FabI2. TCL occupies and orients the inhibitory mode in the active site of FabI2. (C) 3D view of molecular interactions of the FabI2-TCL complex. TCL is depicted as magenta stick representation. The phenolic ring of TCL and nicotinamide ring of NADH are stacked by face-to-face weak hydrophobic interactions. The phenolic oxygen of TCL forms an H-bond (green dash) with Y188 of FabI2. (D) Two-dimensional (2D) representation of molecular interactions between FabI2 and TCL. (E) MD optimized model of mFabI2. NADH is shown as stick representation. (F) 3D view of docked TCL in mFabI2. TCL cannot occupy and orient in an inhibitory mode in the active site of mFabI2. TCL is shown as blue stick representation. (G) 3D view of molecular interactions of the mFabI2-TCL complex. The orientation and binding pattern of TCL are completely inverted, where the di-chloro ring of TCL occupies the wide and shallow region of the catalytic cavity of mFabI2. TCL cannot form an H-bond with catalytic residues of mFabI2. TCL is shown as blue stick representation. (H) 2D representation of molecular interactions between mFabI2 and TCL.

