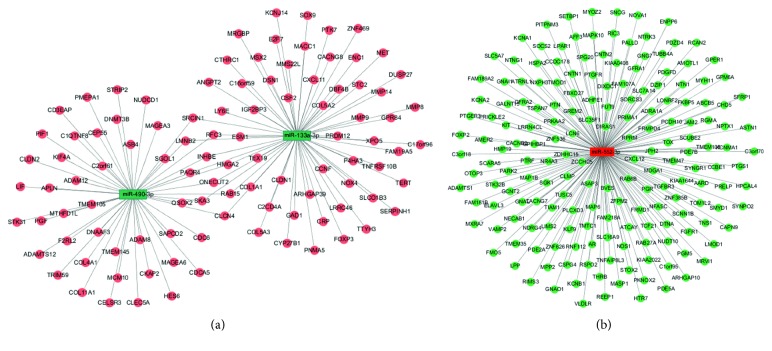
Figure 10.
Regulatory networks of miRNA-mRNA: (a) miR-490-3p and miR-133a-3p and (b) miR-552-3p. miRNA-mRNA regulatory networks were visualized by the Cytoscape software. The rectangles and circles represent the miRNAs and target genes, respectively. The green color represents the low expression, and the red color represents the high expression.

