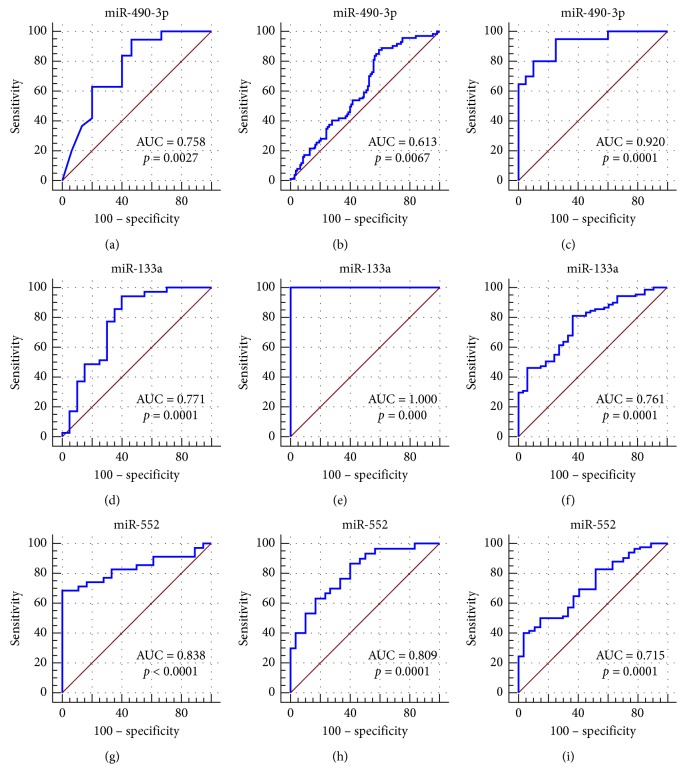
Figure 18.
Verification of the diagnostic value of the three differentially expressed miRNAs based on Gene Expression Omnibus (GEO) DataSets. The receiver-operating characteristic (ROC) curves were drawn using the MedCalc software. (a) CRC GSE89974. (b) ESCA GSE55856. (c) GAC GSE93415. (d) CRC GSE89974. (e) ESCA GSE114110. (f) GAC GSE30070. (g) CRC GSE89974. (h) ESCA GSE66274. (i) GAC GSE30070. AUC: area under the ROC curve; CRC: colorectal cancer; ESCA: esophageal carcinoma; GAC: gastric adenocarcinoma.

