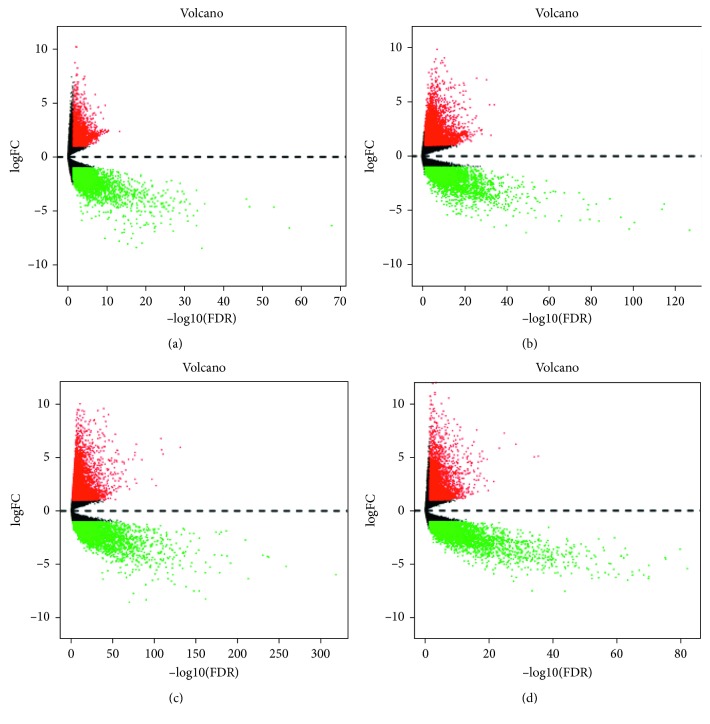
Figure 2.
Differential expression of the mRNA volcano map in four kinds of cancers of the digestive tract: (a) esophageal carcinoma (ESCA); (b) gastric adenocarcinoma (GAC); (c) colon adenocarcinoma (COAD); (d) rectal adenocarcinoma (READ). Among 6926 DEMs in ESCA tissues, 2515 were upregulated and 4411 were downregulated, while 11558 and 7922 were upregulated and downregulated, respectively, in 3636 DEMs in GAC tissues, and 205 were upregulated and 250 were downregulated among the 455 DEMs in COAD tissues. Of the 9335 READ DEMs, 5144 were upregulated and 4191 were downregulated. The volcano map was drawn by the R language gplots package. The difference in expression of upregulated miRNAs (logFC > 1, P < 0.05) was marked in red, and the difference in expression of downregulated miRNAs (logFC > −1, P < 0.05) was marked in green.

