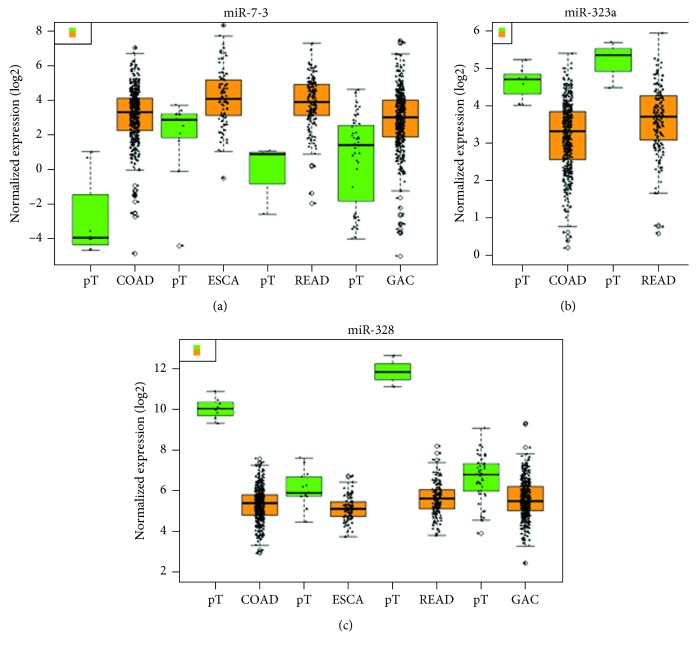
Figure 4.
Boxplot of differential expression of (a) miR-7-3, (c) miR-328, and (b) miR-323a in gastrointestinal adenocarcinoma—colon adenocarcinoma (COAD), esophageal carcinoma (ESCA), rectal adenocarcinoma (READ), and gastric adenocarcinoma (GAC). In the boxplot, the abscissa represents the type of cancer and the ordinate represents the log 2 value of the expression. The brownish yellow color represents the tumor sample, and the green color represents the sample of the paracancerous control tissue.

