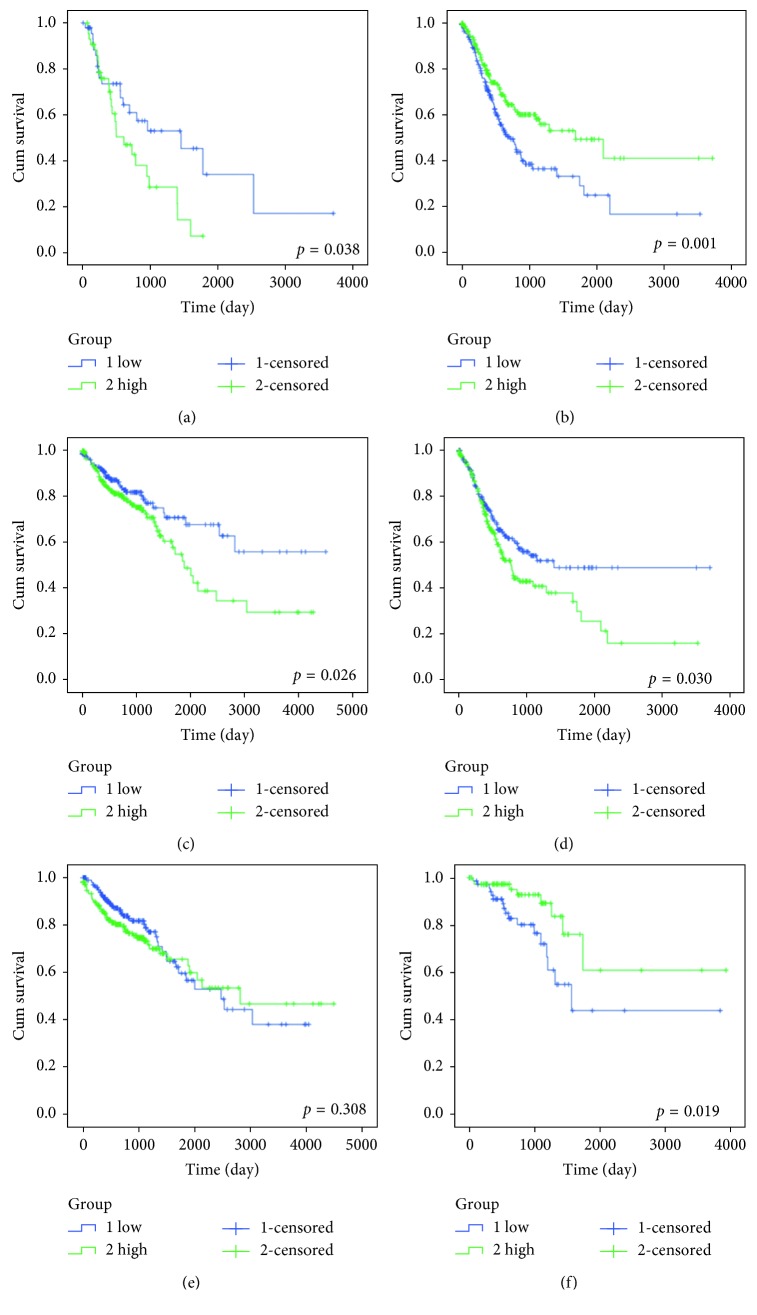
Figure 5.
K-M survival curve of miR-7-3, miR-328, and miR-323a in the cancers of the digestive tract—ESCA (esophageal adenocarcinoma), GAC (gastric adenocarcinoma), COAD (colon adenocarcinoma), and READ (rectal adenocarcinoma). K-M survival curve was drawn by the SPSS 19 software. The transverse coordinates represent the survival time (the number of days), and the ordinate represents the cumulative survival function. The blue color represents the low expression of the patient, and the green color represents the high expression of the patient. (a) ESCA miR-7-3. (b) GAC miR-7-3. (c) COAD miR-328. (d) GAC miR-328. (e) COAD miR-323a. (f) READ miR-323a.

