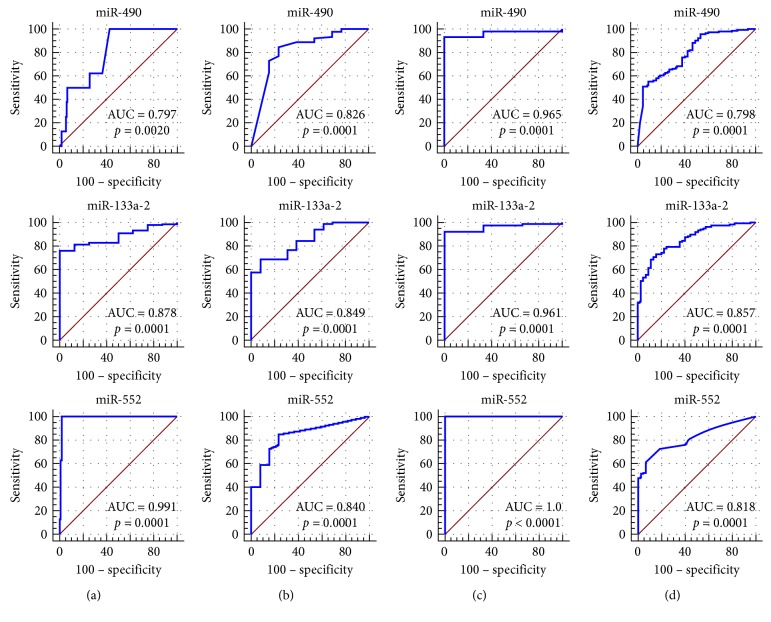
Figure 8.
ROC curve of the diagnostic value of miR-490, miR-133a-2, and miR-552 in adenocarcinoma of the digestive tract: (a) COAD (colon adenocarcinoma); (b) ESCA (esophageal carcinoma); (c) READ (rectal adenocarcinoma); (d) GAC (gastric adenocarcinoma). The ROC curve was generated by the MedCalc software. The transversal coordinates represent 100−specificity, and the ordinate is sensitivity.

