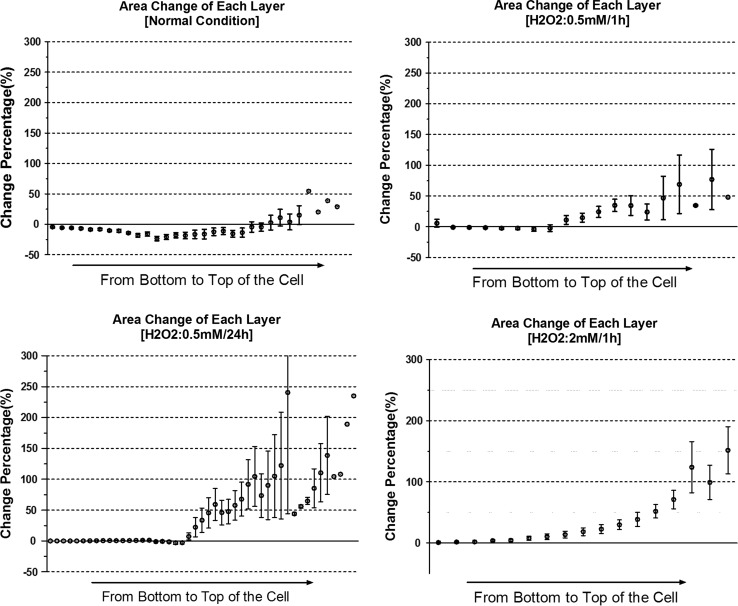
Figure 3.
Comparison of the post-photoporation area change in each cross-sectional layer of single myoblasts in different groups. The error bar represents the SEM of the percentage changes at the same height of different cells, i.e. the same distance between the layer and the cell bottom. The isolated data points without error bar present the data of the higher layers belonging to the thickest cell. Quantification was based on the same myoblast samples in Fig. 2.

