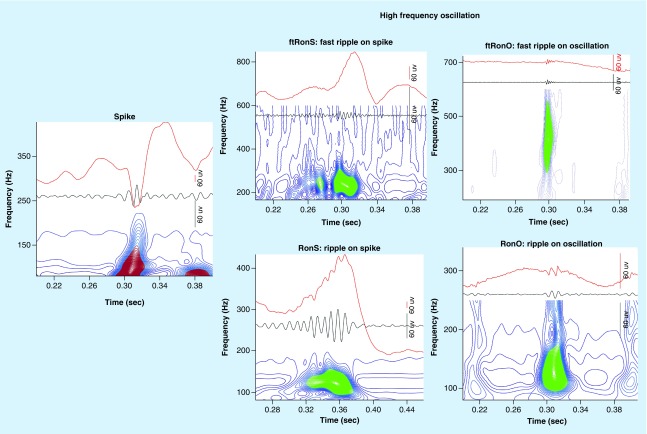
Figure 1. . Illustration of a spike (left) and the different subtypes of high-frequency oscillation (right) found in the intracranial electroencephalogram.
The raw trace is shown in red (top), the band-pass filtered trace in black and wavelet convolution following topographical analysis (below). Note that the spike (left) does not exhibit a ripple or fast ripple as evident by open-countour loops (red) and no closed contour groups (right, green).

