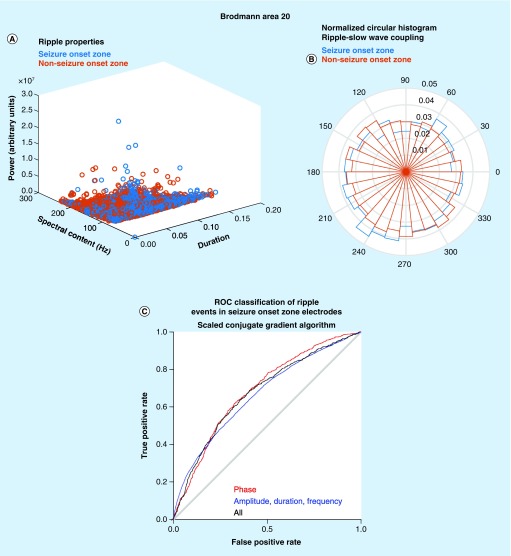
Figure 2. . Proof of principle of the utility of machine learning strategies for identifying pathological ripple events.
(A) Scatter plot of the explicit ripple property values for ripple events recorded from electrode sites in the Brodmann area 20 seizure onset zone (seizure onset zone [SOZ], blue) and non-SOZ (red). (B) Normalized circular histogram of the phase angle of preferred coupling between slow waves and ripple oscillations for events recorded from SOZ sites (blue) and non-SOZ sites (red). (C) ROC curve derived from the classification of a test set of ripple oscillations in Brodmann area 20. The results from a neural network utilizing a scaled conjugate gradient algorithm with phase angle features for slow-, δ- and spindle-coupling (red), explicit ripple property features (blue) and a combined model (black).
ROC: Receiver operating characteristic.

