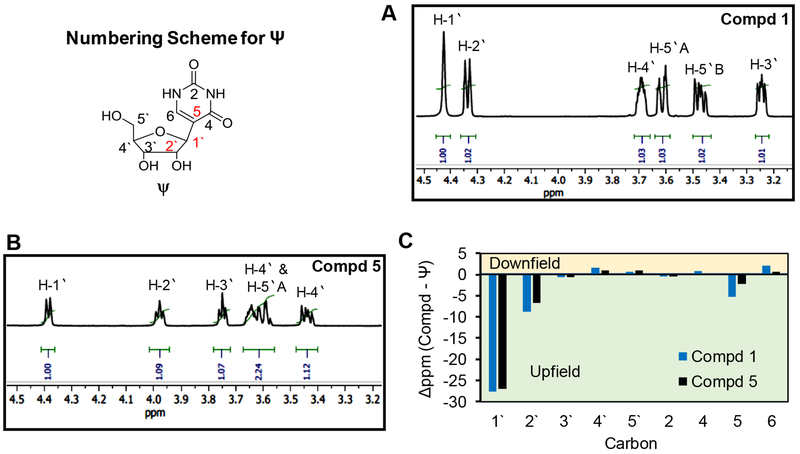
Figure 2.
NMR data for compounds 1 and 5. The 1H-NMR for (A) 1 and (B) 5 showing the sugar resonances. The assignments are interpreted with the assistance of 1H,1H-COSY and 1H,1H-TOCSY spectra. Panel C is a plot of the change in 13C signals for 1 and 5 relative to the parent nucleoside Ψ (Δppm = 1 - Ψ). The assignments were made with the aid of 1H,13C-HSQC spectra. The numbering scheme for Ψ is provided in the upper left-hand corner of the figure and all NMR spectra can be found in Figures S2–S11.

