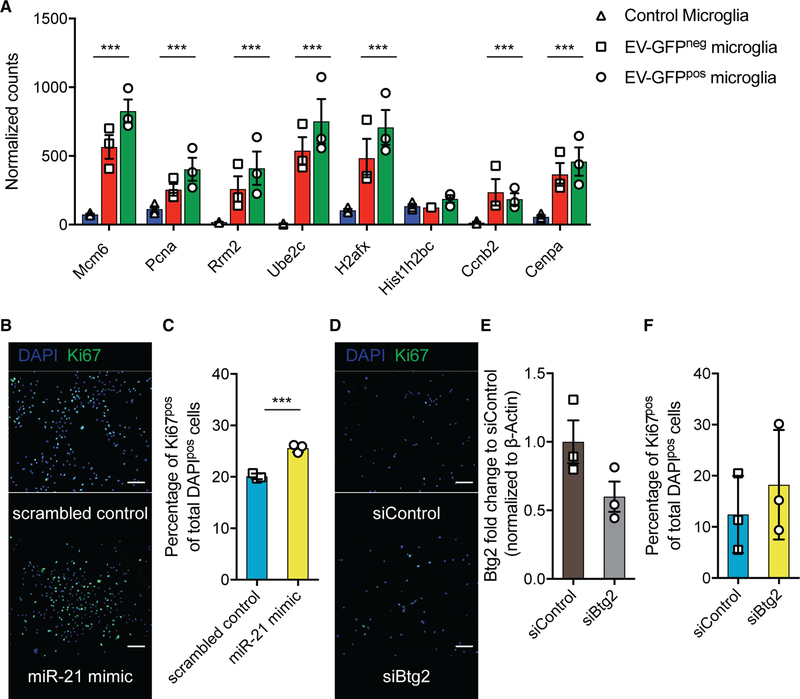
Figure 7. Btg2 Downregulation Leads to Increased Microglia Proliferation.
(A) Normalized read count of genes involved in microglia proliferation (Hammond et al., 2019).
(B) Representative images of in vitro culture miR-21-null microglia transfected with miR-21 mimic and control showing DAPI and Ki67 staining 24 h after transfection. Scale bar, 100 μm.
(C) Quantification of proliferation 24 h after transfection with miR-21 mimic or control as measured by Ki67-positive cells per total number of DAPI-positive cells.
(D) Representative images of in vitro culture miR-21-null microglia transfected with siRNA against Btg2 and siRNA control showing DAPI and Ki67 staining 24 h after transfection. Scale bar, 100 μm.
(E) Quantification of proliferation 24 h after transfection with siRNA against Btg2 or control as measured by Ki67-positive cells per total number of DAPI-positive cells.
Data represent three independent experiments and are presented as the mean with SEM (error bars). ***p < 0.001, multiple testing adjusted p value differential expression in (A), and ***p < 0.001, unpaired t test in (C), (E), and (F).

