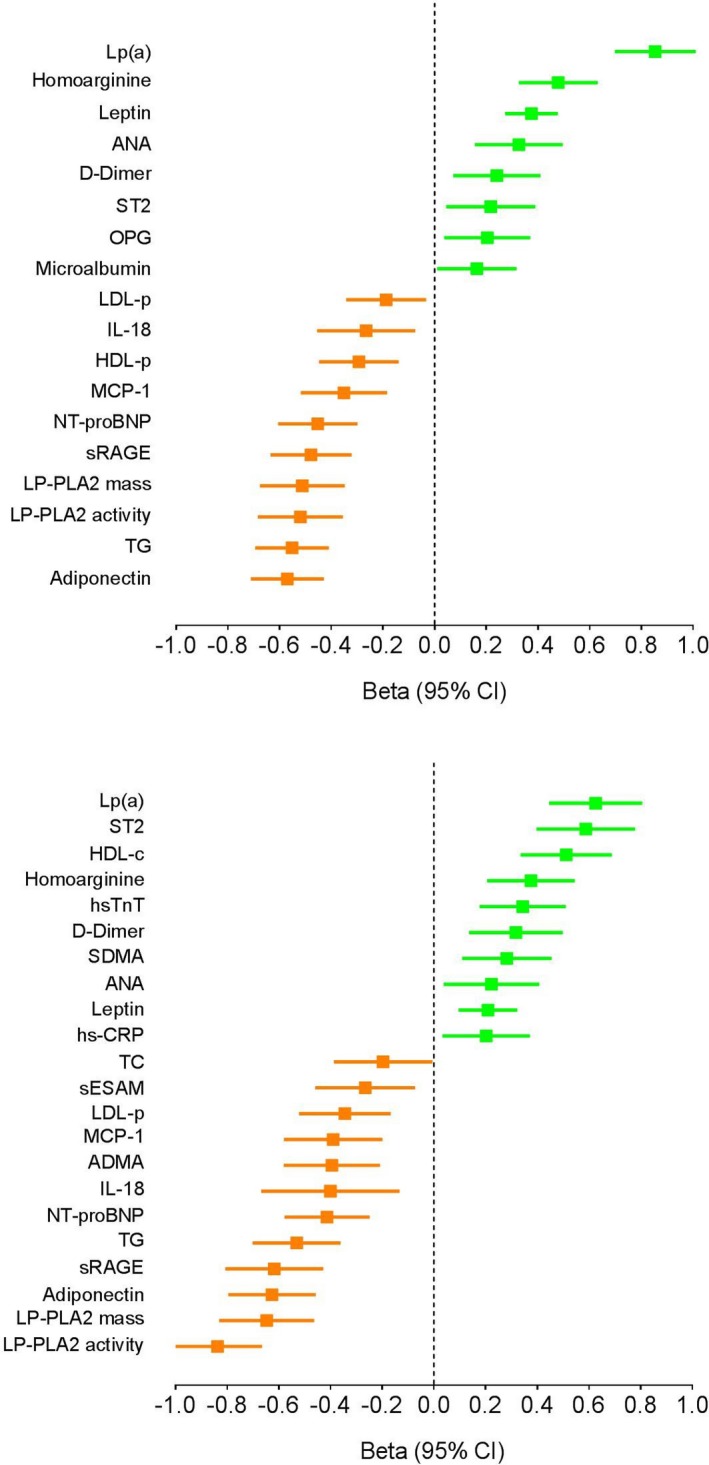
Figure 2.

Multivariable association of biomarkers with race. Associations of black race with biomarker concentrations among women (top panel) and men (bottom panel). Fully adjusted standardized beta coefficients are presented, ordered by strength of association. Positive beta coefficients reflect biomarkers higher in black participants and negative beta coefficients identify biomarkers lower in black individuals. Biomarkers not significantly different between black and white participants in fully adjusted analyses are not shown. ANA indicates antinuclear antibodies; HDL‐c, high‐density lipoprotein cholesterol; HDL‐p, high‐density lipoprotein particle concentration; hs‐TnT, high‐sensitivity troponin T; LDL‐p, LDL particle number; LP(a), lipoprotein a; LP‐PLA2, lipoprotein phospholipase A2; MCP‐1, monocyte chemoattractant protein‐1; NT‐proBNP, N‐terminal pro‐B‐type natriuretic peptide; OPG, osteoprotegerin; SDMA, symmetrical dimethylarginine; sRAGE, soluble receptor for advanced glycation end products; ST, suppression of tumorigenicity; TC, total cholesterol; TG, triglyceride.
