
Figure 1.
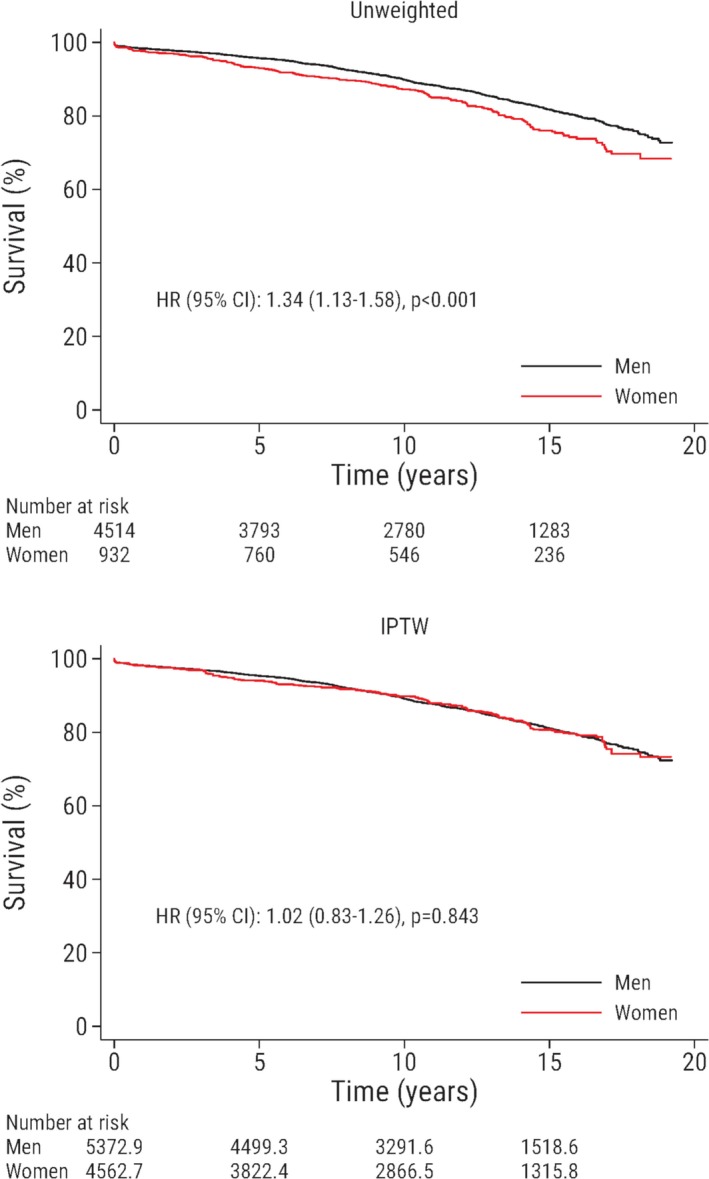
Survival is plotted against time after surgery and stratified according to sex. The upper panel shows the unweighted study population, and the lower panel shows the weighted sample. Male patients are the reference group. The numbers of patients at risk are not necessarily integers in the lower panel because of inverse probability of treatment weighting. HR indicates hazard ratio; IPTW, inverse probability of treatment weighting.