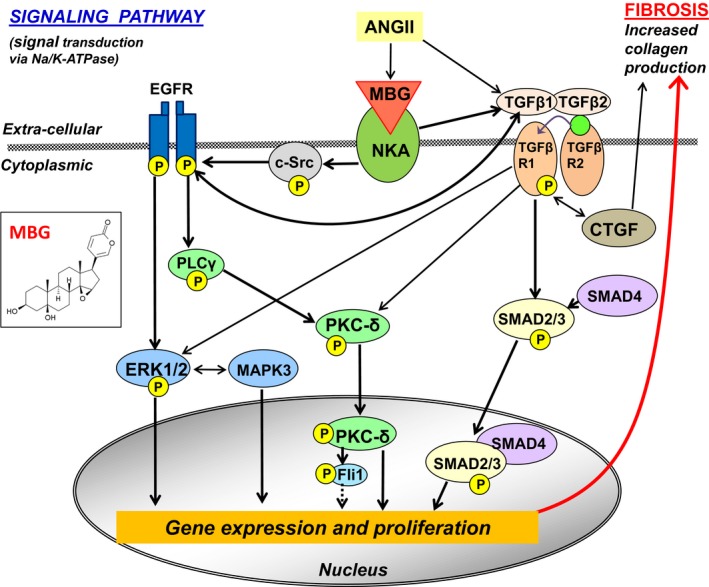
Figure 8.

Schematic presentation of signaling (non‐Mothers Against DPP Homolog [SMAD] and SMAD‐dependent) pathways initiated by marinobufagenin via interaction with Na/K‐ATPase. ANGII indicates angiotensin II; c‐Src, proto‐oncogene tyrosine‐protein kinase; EGFR, epidermal growth factor receptor; ERK1/2, mitogen‐activated protein kinase (MAPK); Fli‐1, Friend leukemia integration 1 transcription factor, a negative regulator of collagen‐1 production; NKA, Na/K‐ATPase; PLCγ, phospholipase C gamma; PKCδ, protein kinase C delta; TGFβ, transforming growth factor‐β; TGFβR, TGFβ receptor. The dotted line indicates the release of the procollagen DNA promoter by phosphorylated Fli1; “P” in yellow circle, phosphorylated form of the protein. The chemical structure of marinobufagenin (MBG) is given in the insertion on the left.
