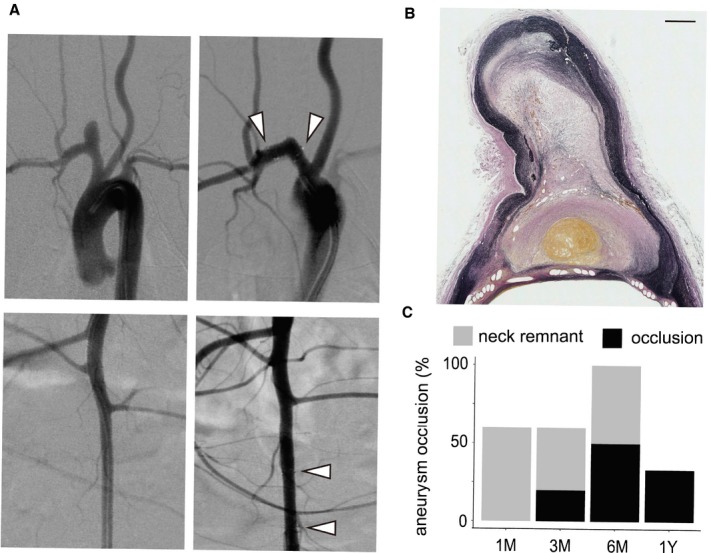
Figure 3.

Representative images of the occluded aneurysm. A, Angiographic images of the aneurysm and the lumbar artery are shown. The first column displays the images before the implantation of the device, and the second column displays the images after the implantation of the device. The white arrowhead indicates the position of the gold marker. B, Elastica–van Gieson staining of the aneurysm showing a fresh thrombus and organized tissue within the aneurysm dome (bar=500 μm). C, Aneurysm occlusion profile at each time point.
