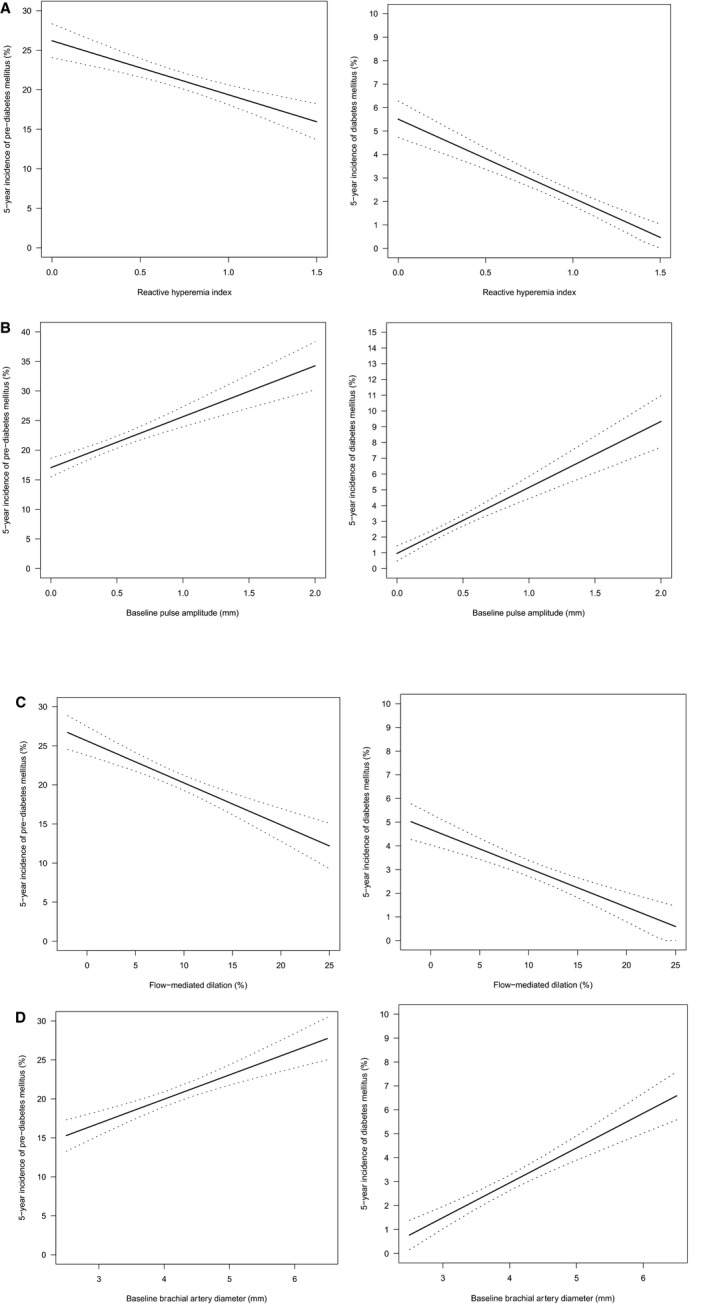
Figure 2.

Endothelial function and incidence of (pre–)diabetes mellitus. A, Reactive hyperemia index, B, Baseline pulse amplitude, C, Flow‐mediated dilation, D, Baseline brachial artery diameter. Binomial plots presenting the incidence of (pre–)diabetes mellitus over the range of endothelial function variables at baseline, as indicated by a regression line with 95% CI.
