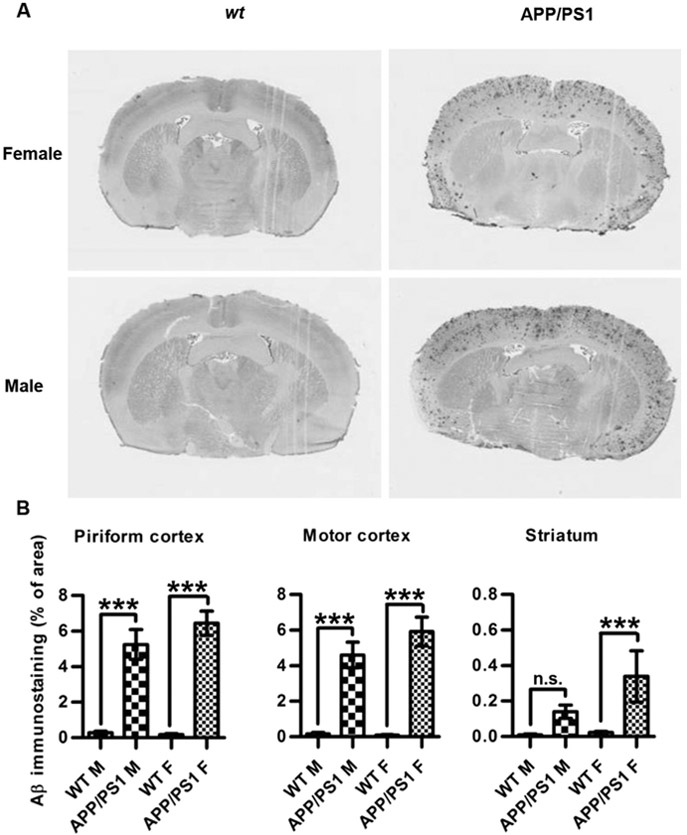
Fig. 2.

Aβ immunohistochemical staining in APP/PS1 and wt mouse brain sections. (A) Representative slide micrographs showing Aβ staining in wt (left column) and APP/PS1 (right column) brain sections from females (top row) and males (bottom row). (B) Aβ staining in the different experimental groups (n = 4 in each group). Asterisks indicate statistical significances in Aβ staining densities between wt and TG male and female brains, respectively; ***; p < 0.001, *; p < 0.05, n.s.; not significant (1-way ANOVA with Bonferroni's post-hoc correction for multiple comparisons between wt and TG within male and female groups, respectively).
