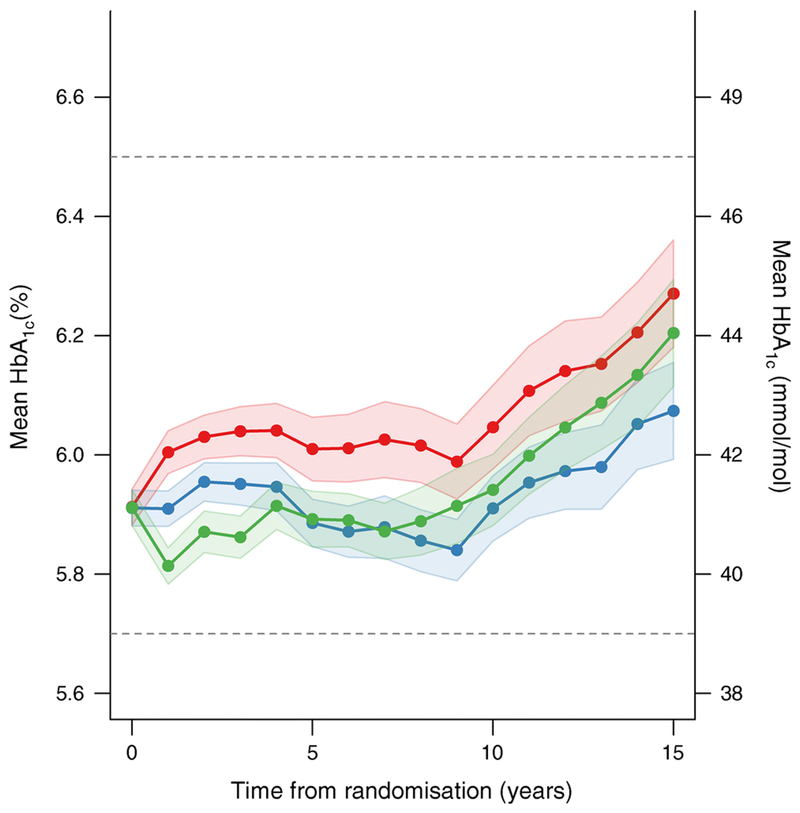
Fig. 1.
HbA1c levels and 95% confidence interval bands, measured annually over time in DPP/DPPOS in all participants based on original intention-to-treat assignments (red, placebo; green, intensive lifestyle intervention; blue, metformin). The colored area surrounding each line represents the 95% CI. The differences in the mean HbA1c over time for intensive lifestyle intervention vs placebo, and metformin vs placebo, were significant (p<0.001). The dashed lines reflect the HbA1c levels currently used by the American Diabetes Association to define ‘prediabetes’ (5.7–6.4% [39–46 mmol/mol]) and diabetes (≥6.5% [48 mmol/mol]). Values in mmol/mol on the right-hand y-axis are converted from the % values on the left and rounded up or down. This figure is available as a downloadable slide.

