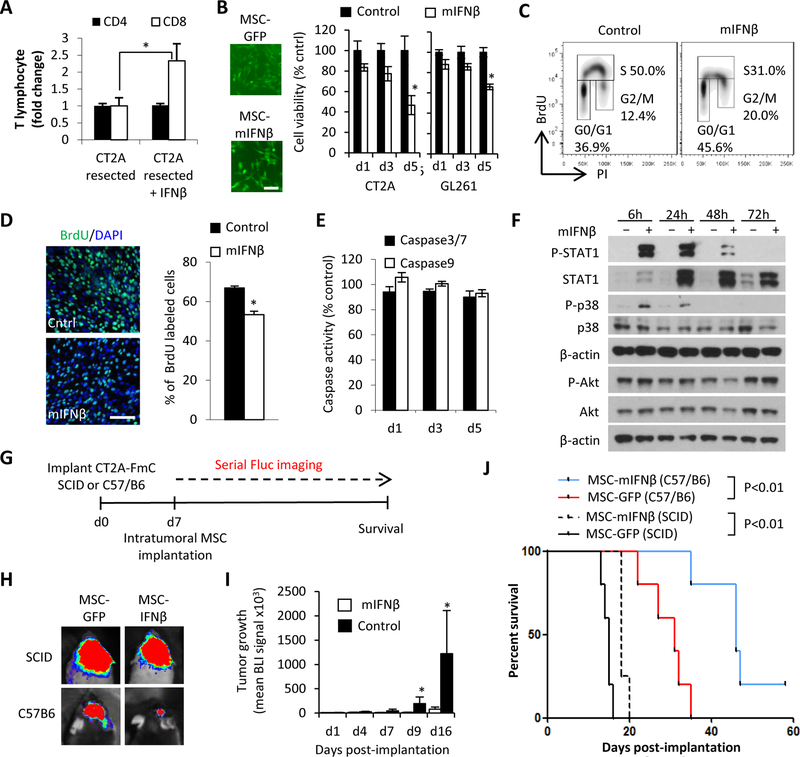
Figure 2. IFNβ boosts infiltration of CD8+ T cells post-tumor resection and has direct and indirect anti-tumor effects:
(A) CD4+ and CD8+ T cells recruitment at 5 days post-tumor resection in response to mouse IFNβ. (B) (left) Fluorescence images of MSC-GFP and MSC-mIFNβ. Scale bar, 100 μm (right) Viability of CT2A and GL261 cells treated for 1, 3 and 5 days with CM of MSC-mIFNβ and MSC-GFP. (C) Representative flow cytometry density plots of cell cycle analysis and (D) immunocytochemical quantification of CT2A cells treated with mIFNβ CM for 72h and followed by a 1h BrdU pulse. BrdU positive nuclei (green)/ DAPI (blue). Scale bar, 100 μm (E) Comparison of Caspase 3/7 and 9 activity in CT2A-FmC cells cultured with mIFNβ CM for 1, 3 and 5 days. (F) Western blot analysis on CT2A cell lysates collected 6, 24, 48 and 72hrs after treatment with mIFNβ showing phosphorylation status of STAT1 (Tyr701), p38 (T189/Y182), and Akt (S473). (G) Scheme for testing efficacy of intratumoral MSC-mIFNβ or MSC-GFP in intact CT2A-FmC tumors in SCID (n=5 for MSC-GFP, n=4 for MSCmIFNβ) and C57/B6 mice (n=5 in each group). (H) Representative visible light plus superimposed bioluminescence images (BLI) of mice from each treatment group 16 days post-MSC implantation. (I) Plot of mean tumor growth following intratumoral MSC injections in C57/B6 mice. (J) Kaplan-Meier survival curves of C57/B6 or SCID mice bearing CT2A-FmC tumors intratumorally injected with MSC-mIFNβ or MSC-GFP.

