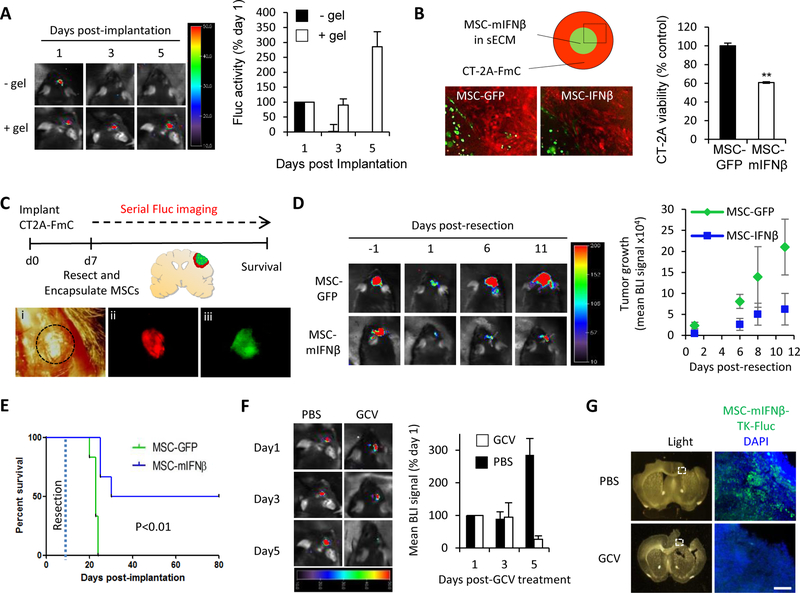
Figure 3. MSC-mIFNβ show antitumor efficacy in resected GBM, leading to increased survival of mice and can be eliminated post-therapy:
(A) Representative BLIs and plot of mean Fluc signal intensity of mice bearing intracranial MSC-GFP-Fluc cells with or without sECM encapsulation (1 × 10⁶ cells/mouse, n=4/group) (B) Schematic and fluorescence images showing MSC-GFP or MSC-mIFNβ cells encapsulated in sECM (1 × 10⁴ cells/drop), surrounded by CT2A-FmC cells. Plot showing CT2A cell viability at day5 (C) Scheme for testing efficacy of sECM-encapsulated MSCs expressing GFP or mIFNβ on resected CT2A-FmC tumors (n=6/group): (i) Light image of a craniotomy above tumor, delineated by dashed black circle. (ii, iii) Fluorescence images of before-resected CT2A-FmC tumor (red) and encapsulated MSC-mIFNβ cells in the resection cavity (green). (D) Representative BLIs of mice from MSC-GFP and -mIFNβ groups pre- and post-resection, plot of mean tumor growth and (E) survival curves. (F-G) Resected mice were implanted with sECM-encapsulated MSC-mIFNβ-TK-Fluc (n=6) and treated with GCV (50 mg/kg) or PBS daily for 5 days. (F) Representative BLIs of mice at 1, 3 and 5 days post-GCV treatment and plot of mean tumor growth (G) Light and fluorescence micrographs of coronal brain sections containing encapsulated MSC-mIFNβ-TK-Fluc (green) from brains harvested 7 days post-GCV treatment and DAPI counterstained (blue). White dashed box indicates region of interest. Scale bar 100 μm.

