Figure 3.

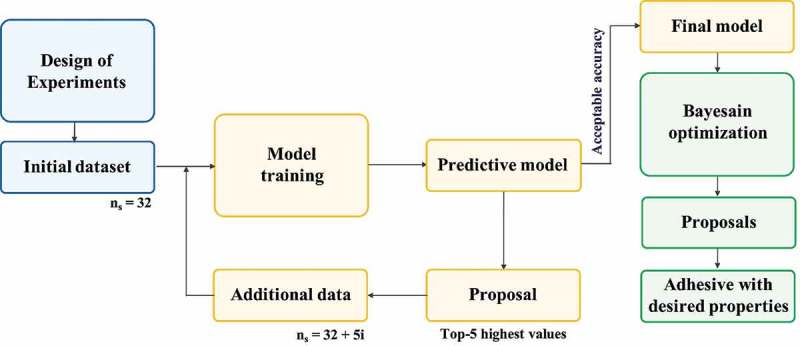
Flowchart of our proposed approach for modelling and optimization. Note that ns indicates the dataset size and i indicates the number of cycles.

Flowchart of our proposed approach for modelling and optimization. Note that ns indicates the dataset size and i indicates the number of cycles.