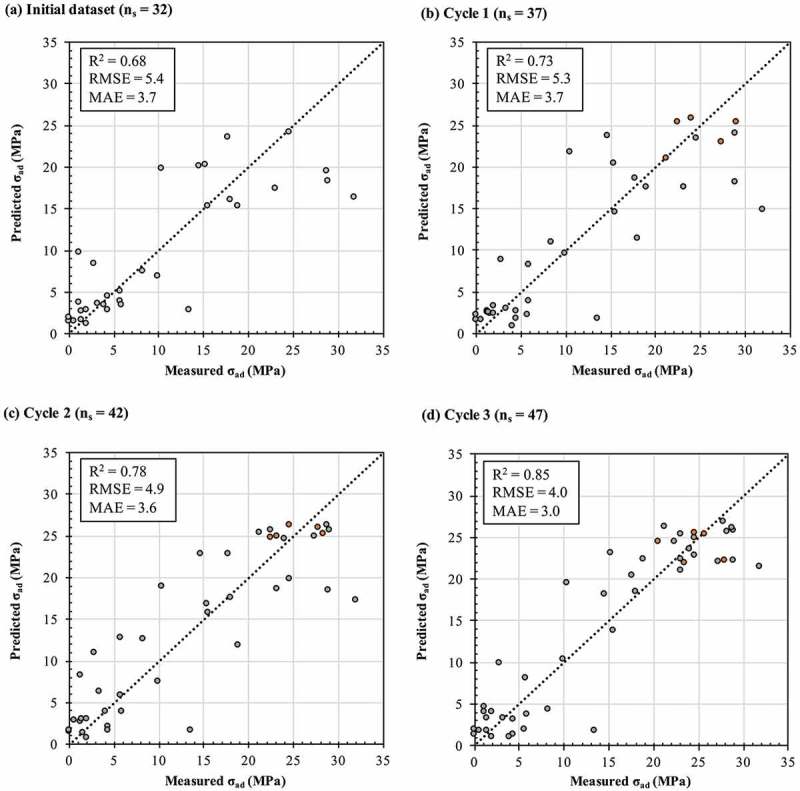
Figure 6.

Correlation scatter plots (test data) of predicted and measured adhesive joint strength σad (MPa) using different dataset sizes ns (samples): (a) initial dataset, (b) cycle 1, (c) cycle 2 and (d) cycle 3. Grey and orange dots indicate data from existing and new measurements, respectively, at cycle i. All proposed experimental conditions are summarized in Table 2. Hyperparameters used for these runs are shown in Table S4 of the Supplemental material.
