Figure 8.

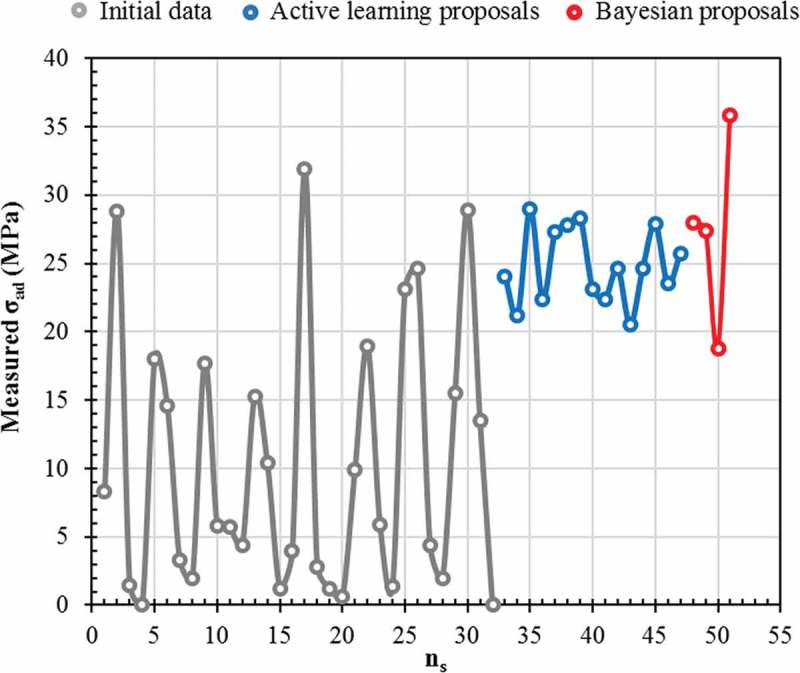
Distribution of adhesive joint strength σad (MPa) measurements from the initial dataset alone (grey), after active learning cycles (blue) and after Bayesian optimization (red). Lines are used to guide the eye only.

Distribution of adhesive joint strength σad (MPa) measurements from the initial dataset alone (grey), after active learning cycles (blue) and after Bayesian optimization (red). Lines are used to guide the eye only.