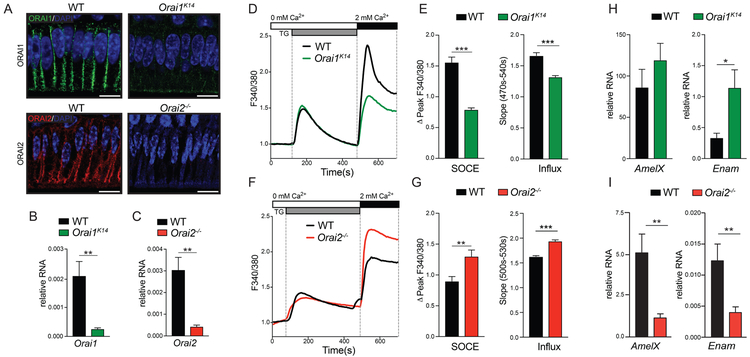
Fig. 2. Abnormal SOCE in primary ameloblasts from ORAI1- and ORAI2-deficient mice.
(A) Immunofluorescence staining for ORAI1 and ORAI2 of ameloblasts from WT, Orai1K14, and Orai2−/− mice. Nuclear staining by 4′,6-diamidino-2-phenylindole (DAPI) is shown in blue. Images are representative of n = 3 mice for each genotype. Scale bars, 20 μm. (B and C) Analysis of (B) Orai1 and (C) Orai2 gene expression in ameloblast cells isolated from Orai1K14 and Orai2−/− mice, respectively. Data represent the mean ± SEM of three independent experiments with ameloblasts obtained from five to seven mice for each genotype. (D to G) Measurements of [Ca2+]i (shown as F340/F380 ratio) in ameloblasts of WT, Orai1K14 (D and E), and Orai2−/− (F and G) mice after thapsigargin (TG) stimulation. The peaks of F340/F380 corrected for baseline levels (ΔPeak F340/F380) and the slope are quantified in (E) and (G). Data represent the mean ± SEM of three independent experiments, with ameloblasts obtained from four to five mice for each genotype. (H and I) RT-PCR analysis of enamel gene expression in ameloblasts of Orai1K14 (H) and Orai2−/− (I) mice. Data represent the mean ± SEM of three independent experiments, with ameloblasts obtained from five mice for each genotype. *P < 0.05, **P < 0.01, ***P < 0.001, ****P < 0.0001 using unpaired Welch’s t test (B and H), Mann-Whitney test (C, E, and G), or Student’s t test (I).

