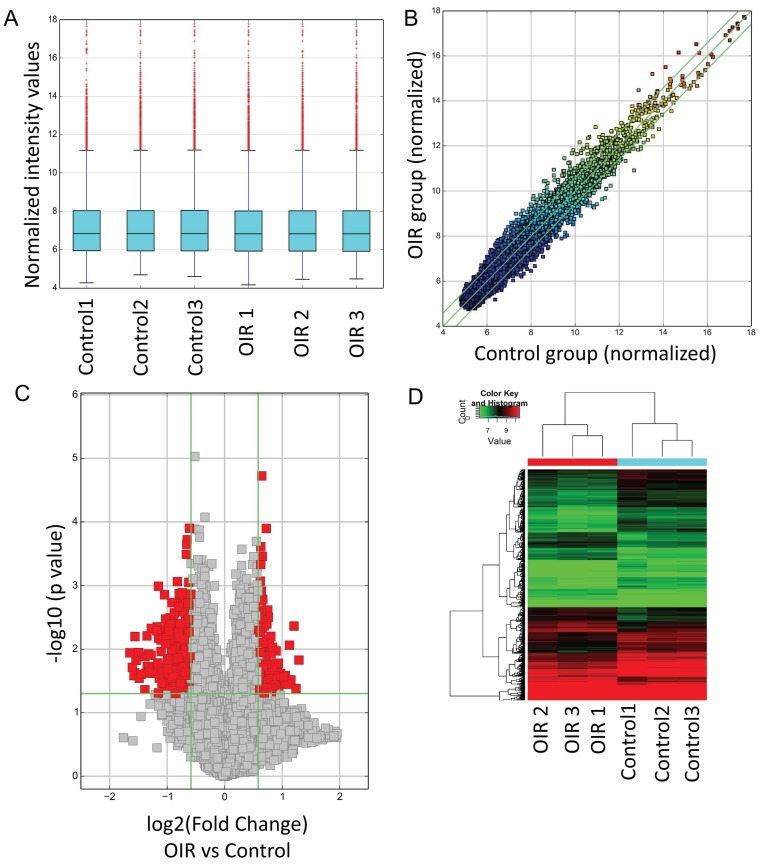
Figure 1.
Altered circRNAs between OIR retinas and room air control retinas by microarray analysis. A. Box plot. The expression profiles of circRNAs were shown as a box plot after normalization. B. Scatter plot. A scatter plot is used to show the raw variations of the expression profile between the two groups. C. Volcano plot. The horizontal line represents P=0.05, and the red points represent the statistical altered circRNAs. The green lines in B and C represent the default significant fold change (1.5). D. Hierarchical cluster analysis (heat map) represents all of the altered circRNAs between the two groups. Red and green denoted high and low expression, respectively.

